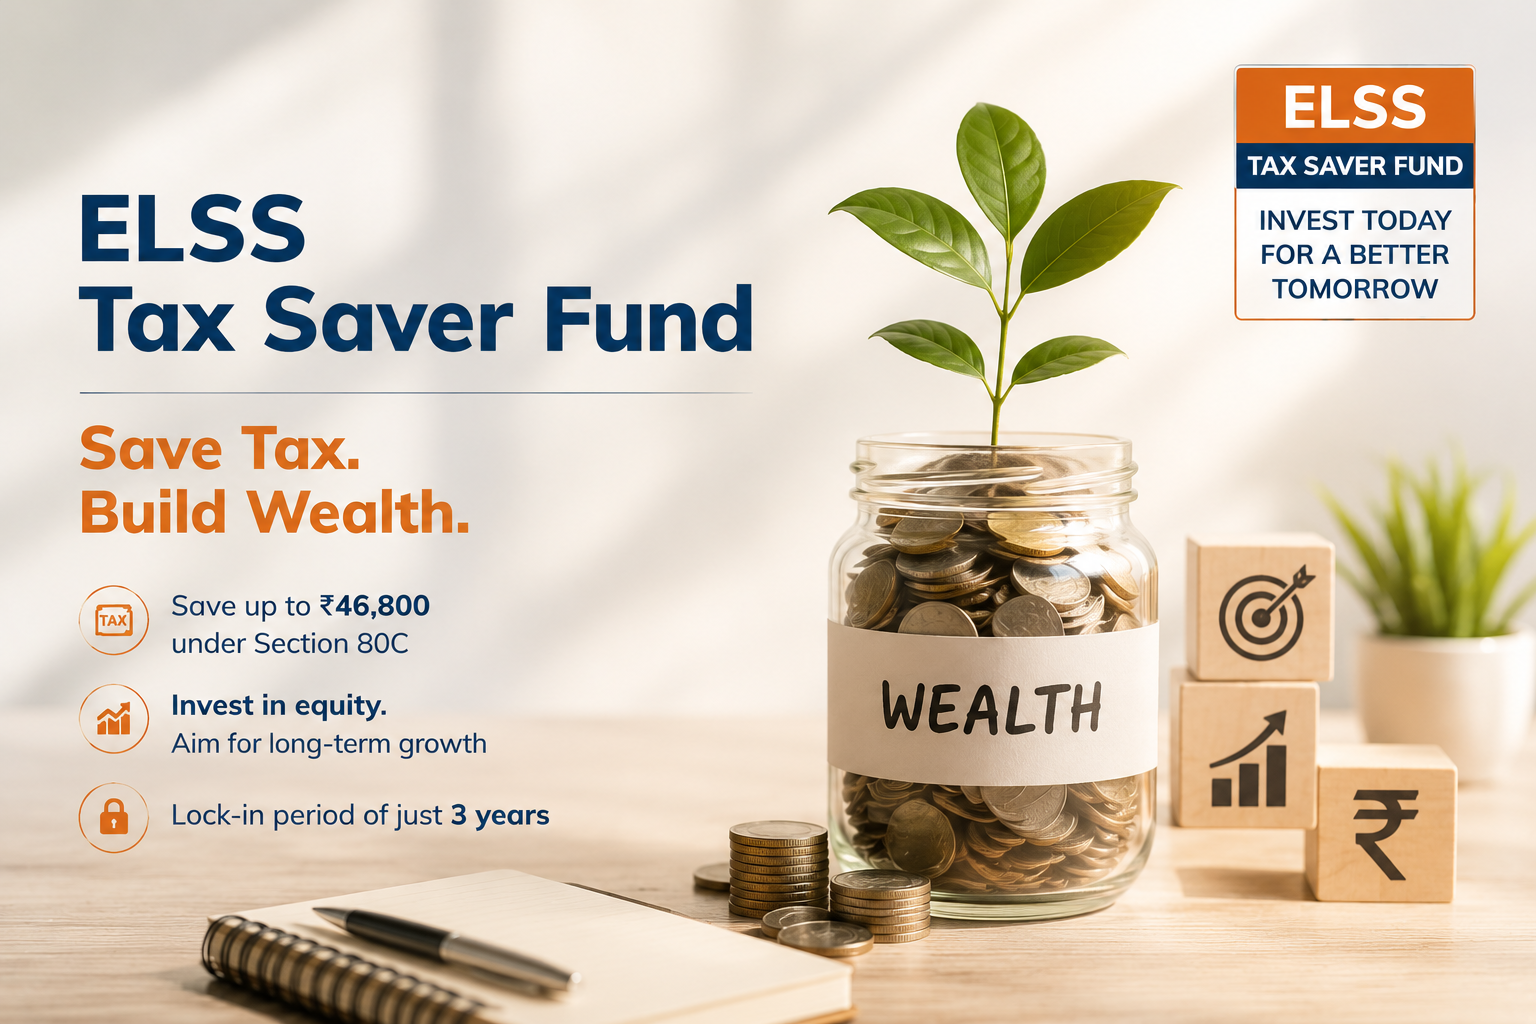
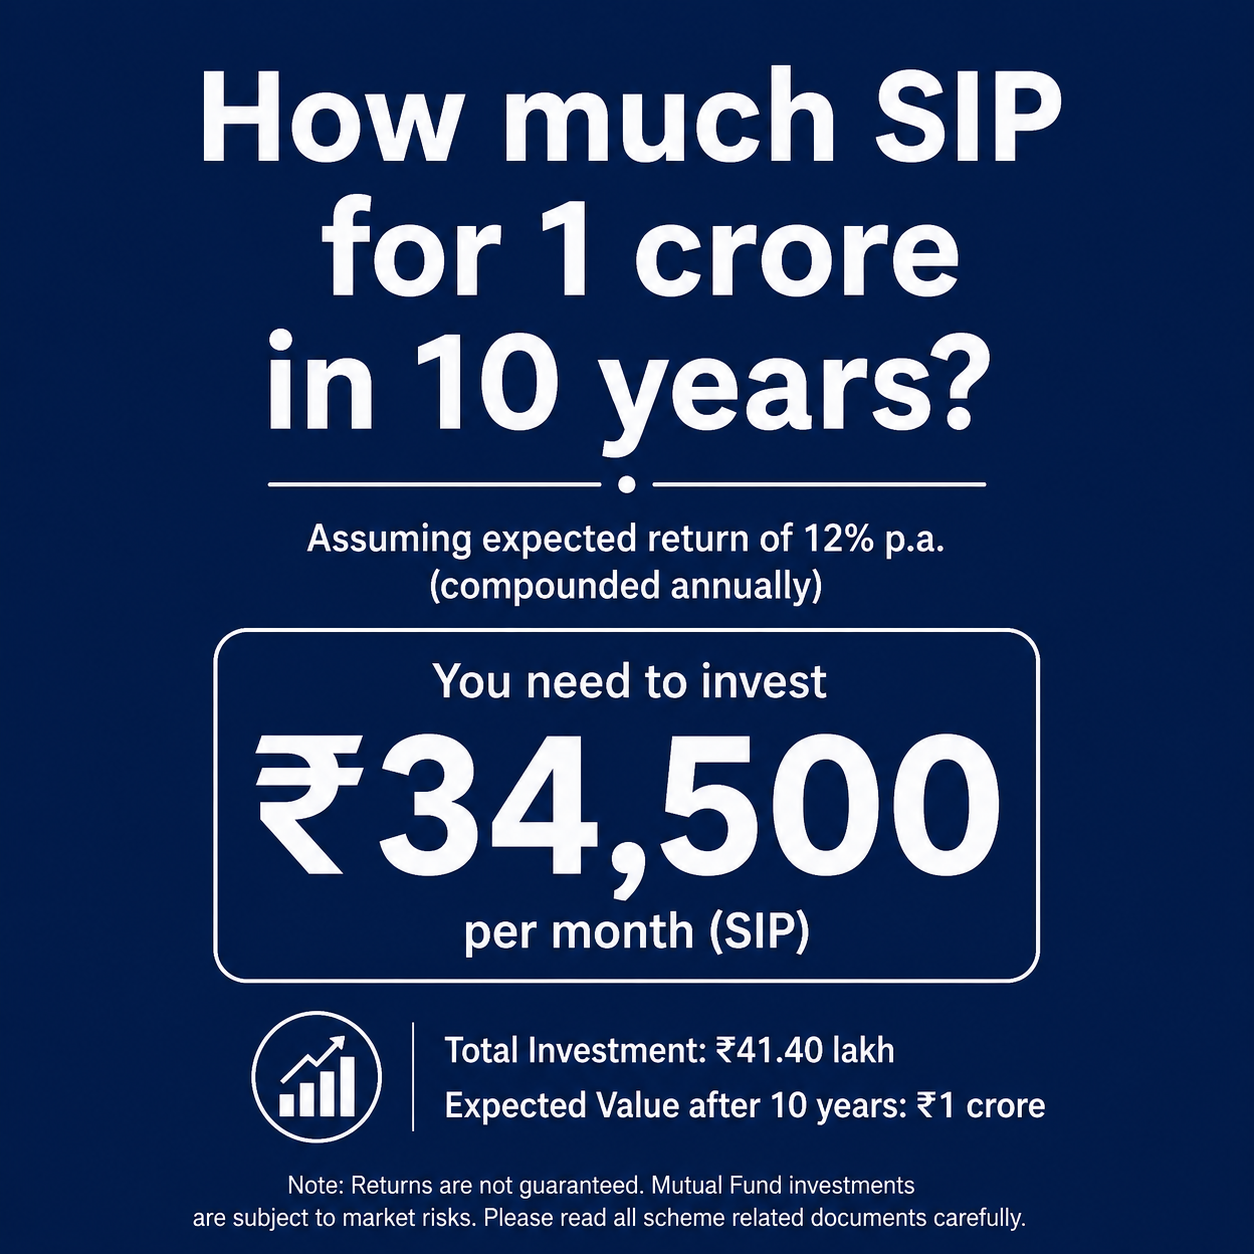
Top 5 Technical Indicators Every Indian Stock Market Trader Must Master

TECHNICAL INDICATORS

A Comprehensive Guide to Reading Charts, Timing Trades, and Building Consistent Profits on NSE & BSE


Technical analysis is not a crystal ball — it is a language. Once you learn to read it fluently, the market begins to speak to you in patterns, probabilities, and price action. This guide decodes five of the most powerful technical indicators used by professional traders on India’s NSE and BSE every single day.


Introduction: Why Technical Indicators Matter in the Indian Market

India’s stock market is one of the most dynamic in the world. With over 5,000 listed companies on the NSE and BSE, daily volumes crossing ₹50,000 crore on the cash segment alone, and a growing base of retail investors now numbering over 9 crore registered investors with SEBI, the competition to generate alpha is fiercer than ever.

In such an environment, trading purely on “tips,” news headlines, or gut instinct is a recipe for losses. This is where technical analysis becomes indispensable. Technical indicators are mathematical calculations based on a stock’s historical price, volume, or open interest. They help traders identify trends, momentum, volatility, and potential reversal points — all in real time.

Whether you are trading Reliance Industries on the NSE, swing trading mid-cap IT stocks, or day-trading Nifty 50 futures on the F&O segment, the five indicators covered in this article form the foundation of a robust trading system.

Let’s dive deep into each one.


What It Is

A Moving Average is one of the oldest and most widely used technical indicators. It smooths out price data by creating a constantly updated average price over a chosen time period, filtering out the “noise” of daily fluctuations to reveal the underlying trend.

There are two primary types you must know:

  • Simple Moving Average (SMA): Calculates the arithmetic mean of closing prices over N days. Every data point gets equal weight.
  • Exponential Moving Average (EMA): Gives more weight to recent prices, making it more responsive to new information. This makes EMA particularly useful in fast-moving Indian markets.

How to Use It

The 50-day and 200-day EMAs are the gold standard for Indian equity traders. The relationship between these two lines is critical:

  • Golden Cross: When the 50-day EMA crosses above the 200-day EMA, it signals a potential bullish trend. This is one of the most reliable buy signals in technical analysis. A Golden Cross on Nifty 50 or a large-cap like HDFC Bank historically precedes sustained upward moves.
  • Death Cross: When the 50-day EMA crosses below the 200-day EMA, it signals a bearish trend. Many traders use this as a strict exit signal.

For intraday trading on NSE: The 9-period and 21-period EMAs on a 15-minute chart are extremely popular. When price is above the 9 EMA, and the 9 EMA is above the 21 EMA, you are in a strong uptrend — look only for buy opportunities.

Dynamic Support and Resistance: Moving averages also act as support in uptrends and resistance in downtrends. Notice how Nifty 50 bounces off the 200-day EMA during corrections — this level is watched by every institutional desk in Mumbai.

Practical Example

Suppose TCS is trending upward. The stock corrects slightly and touches its 50-day EMA. If price bounces from this level with high volume, it is a textbook “buy the dip” setup. Your stop-loss goes just below the 50-day EMA, and your target is the previous high.

Key Settings for Indian Markets

  • Positional Trading (weeks to months): 50 EMA and 200 EMA on daily charts
  • Swing Trading (days to weeks): 20 EMA and 50 EMA on daily charts
  • Intraday (minutes to hours): 9 EMA and 21 EMA on 5-minute or 15-minute charts

2. Relative Strength Index (RSI) — The Momentum Meter

What It Is

Developed by J. Welles Wilder, the Relative Strength Index (RSI) is a momentum oscillator that measures the speed and magnitude of recent price changes. It oscillates between 0 and 100, giving traders a clear visual of whether a stock is overbought or oversold.

The standard calculation period is 14 days, though many Indian traders use 9 or 21 periods for more or less sensitivity.

How to Use It

The Classic Interpretation:

  • RSI above 70 = Overbought: The stock has risen sharply and may be due for a pullback or consolidation. Not necessarily a sell signal in a strong bull run, but a warning to book partial profits or tighten stop-losses.
  • RSI below 30 = Oversold: The stock has fallen sharply. Selling pressure may be exhausted, and a bounce could be imminent. Look for other confirming signals before buying.
  • RSI at 50 = Neutral: The midpoint. In an uptrend, RSI tends to stay above 50; in a downtrend, it stays below 50.

Divergence — The Hidden Signal:

The most powerful RSI signal is divergence, and it is widely used by seasoned traders on Dalal Street:

  • Bullish Divergence: Price makes a lower low, but RSI makes a higher low. This signals that selling momentum is weakening even as price falls — a strong reversal warning. When this appears in a beaten-down sector like metals or PSU banks, the subsequent rally can be explosive.
  • Bearish Divergence: Price makes a higher high, but RSI makes a lower high. This warns that the rally is losing steam. This setup frequently appears in stocks that have run up significantly in a short time on news-driven momentum.

RSI as Trend Confirmation:

In strong trending markets — like the Nifty Midcap 150 during a bull run — RSI often stays in the 50–80 zone. A pullback to the 40–50 range in an uptrending stock is often a buying opportunity, not a danger signal.

Practical Example

Imagine Bajaj Finance drops sharply over three weeks, and the RSI hits 28. You notice that the previous time RSI hit similar levels (late 2022 correction), the stock subsequently rallied 30% over the next two months. Combined with a support zone on the price chart and a bullish candlestick pattern, this sets up an attractive risk-reward trade.

Pro Tip for F&O Traders

On Bank Nifty options, intraday RSI on a 5-minute chart crossing above 50 from below (after an oversold condition) is a popular signal for buying call options at support levels. Always combine with the overall market trend.


3. Moving Average Convergence Divergence (MACD) — Trend + Momentum in One

What It Is

The MACD (pronounced “Mac-D”) is arguably the most versatile indicator in a trader’s toolkit. Invented by Gerald Appel, it combines trend-following and momentum measurement into a single, elegant tool.

MACD is plotted as three components:

  1. MACD Line: The difference between the 12-period EMA and the 26-period EMA
  2. Signal Line: A 9-period EMA of the MACD line itself
  3. Histogram: A bar chart showing the difference between the MACD line and the Signal line — visually representing momentum strength

How to Use It

Signal Line Crossovers — The Core Signal:

  • Bullish Crossover: MACD line crosses above the Signal line. This is a buy signal, particularly powerful when it occurs below the zero line (meaning after a meaningful correction).
  • Bearish Crossover: MACD line crosses below the Signal line. This is a sell signal, especially significant when it occurs above the zero line (after an extended rally).

The Zero Line:

  • MACD crossing above zero confirms that the shorter-term EMA is now above the longer-term EMA — a bullish trend is established.
  • MACD crossing below zero confirms a bearish trend.

Histogram Analysis:

The histogram is one of the most underused aspects of MACD. When the bars are growing taller (expanding), momentum is increasing. When the bars are shrinking (contracting), momentum is decelerating — a potential signal of an impending reversal or consolidation.

Watch for histogram contraction after a sustained move. In Indian markets, this pattern frequently precedes sector rotations. For example, when IT sector stocks show MACD histogram contraction after a bull run, money often rotates into FMCG or pharma.

MACD Divergence:

Like RSI, MACD divergence is powerful. If Nifty 50 makes a new high but the MACD histogram makes a lower high, it is a warning sign that the broader market rally is running out of fuel.

Practical Example

You are tracking Infosys on a daily chart. The stock has been in a downtrend for two months. One morning, you notice the MACD line crosses above the signal line while both are still below zero. The histogram turns from red to green. This is a classic early-stage bullish reversal setup — institutional buyers may be accumulating. You enter with a stop below the recent low.

Key Settings

  • Standard (Works for Most Indian Stocks): 12, 26, 9
  • Faster (For Intraday on 15-min charts): 5, 13, 6
  • Slower (For Positional/Long-term): 19, 39, 9

4. Bollinger Bands — Measuring Volatility and Price Extremes

What It Is

Invented by John Bollinger, Bollinger Bands consist of three lines plotted around a stock’s price:

  1. Middle Band: A 20-period Simple Moving Average (the trend baseline)
  2. Upper Band: Middle Band + 2 standard deviations (upper price boundary)
  3. Lower Band: Middle Band − 2 standard deviations (lower price boundary)

The bands expand when volatility increases and contract when volatility decreases, making them a dynamic and self-adjusting indicator — perfectly suited to the volatile nature of Indian mid-cap and small-cap stocks.

How to Use It

The Squeeze — Before the Storm:

When the Bollinger Bands come very close together (the “squeeze”), it means the stock is in a period of low volatility and consolidation. This is the market “coiling like a spring.” A breakout — either up or down — is imminent. Many professional traders on NSE scan for Bollinger Band squeezes as their primary trade setup, then wait for direction confirmation before entering.

This is especially powerful in Nifty 50 index trading. A prolonged squeeze on the weekly Nifty chart often precedes a significant directional move — either a breakout to new highs or a sharp correction.

Walking the Bands:

In a strong uptrend, price “walks the upper band” — it repeatedly touches or hugs the upper Bollinger Band. This is not overbought; it is a sign of strength. The mistake many retail traders make is shorting a stock simply because it is touching the upper band. In a trending market, this is a dangerous strategy.

Conversely, price walking the lower band signals intense bearish pressure.

Mean Reversion Trades:

In a sideways or range-bound market (common in many Nifty 50 stocks during consolidation phases), price touching the lower band is a potential buy signal, and touching the upper band is a potential sell/short signal — with the middle band as the target.

%B Indicator: An advanced use of Bollinger Bands, %B measures where price is relative to the bands on a 0–1 scale. Values above 1 mean price is above the upper band; below 0 means price is below the lower band. Very useful for systematic traders.

Practical Example

Asian Paints has been consolidating for six weeks. The Bollinger Bands are extremely narrow — a textbook squeeze. On a Monday, the stock breaks above the upper band on 3x average volume. This is a high-confidence breakout trade. You enter on the breakout candle’s close, with a stop below the middle band, and target the width of the bands projected above the breakout point.

Key Insight for Indian Traders

Combine Bollinger Bands with sector analysis. When an entire sector (say, auto stocks) simultaneously shows a Bollinger Band squeeze with improving MACD momentum, a sector-wide rally may be loading up. This approach is used by many portfolio managers tracking NSE sector indices.


5. Volume — The Forgotten Indicator That Confirms Everything

What It Is

Volume is the number of shares (or contracts) traded in a given period. It is not a mathematical formula — it is raw market data. Yet it is arguably the most important indicator of all, because price moves without volume are suspect; price moves with volume are conviction.

Every technical pattern, every breakout, every reversal — volume is the lie detector that tells you whether the move is real or a trap.

How to Use It

Volume Confirms Breakouts:

The single most critical rule: a breakout from a consolidation zone, a resistance level, or a chart pattern (cup-and-handle, head-and-shoulders, triangle) is only valid if accompanied by above-average volume — ideally 1.5x to 2x the 20-day average volume.

On the NSE, you can see this pattern repeatedly. When Nifty 50 breaks out of a multi-week range on exceptionally high volume (often the first few days after a major economic announcement — RBI policy, Union Budget, quarterly earnings), the move tends to be sustained and significant.

A breakout on low volume is called a false breakout — one of the most dangerous traps for retail traders.

Volume Precedes Price:

Institutional investors — mutual funds, FIIs, DIIs — cannot take large positions overnight. They accumulate over days and weeks. This accumulation often shows up as gradually increasing volume on green days and decreasing volume on red days, even before the stock makes a significant price move. Smart traders watch for this “volume signature” in quality large-cap and mid-cap stocks.

Volume Dry-Up at Support:

When a stock pulls back to a support level on shrinking volume, it means sellers are exhausted. There is little conviction in the selling. This is a bullish sign — the path of least resistance is up. When this is followed by a bounce on increasing volume, the trade setup is compelling.

On-Balance Volume (OBV):

A more refined volume indicator, OBV adds volume on up-days and subtracts volume on down-days, creating a running cumulative total. When OBV is rising even as price consolidates or dips slightly, it signals that smart money is accumulating — a bullish divergence between OBV and price often precedes a significant rally.

Practical Example

You notice that Zomato has been stuck in a tight range between ₹180 and ₹195 for three weeks. Daily volume is low and declining. Then, one Tuesday, the stock jumps to ₹198 on volume that is 4x the 20-day average. This is an institutional-grade breakout. You enter above ₹195 (the breakout level), with a stop at ₹188, targeting ₹220 based on the measured move.

Volume in F&O: Open Interest

In the Indian derivatives market, Open Interest (OI) complements volume powerfully. Rising price + rising OI = fresh long positions being built (bullish). Falling price + rising OI = fresh short positions (bearish). Falling price + falling OI = shorts being covered, potential reversal. These OI patterns on Nifty and Bank Nifty weekly options expiry are monitored by every serious F&O trader in India.


Combining All Five: Building a Complete Trading System

The real power of technical analysis lies not in using one indicator in isolation, but in combining multiple indicators to build high-probability confluences.

Here is a sample framework used by professional traders:

Signal TypeIndicator UsedWhat You’re Checking
Trend DirectionMoving Averages (50/200 EMA)Is price above or below key EMAs?
MomentumRSIIs momentum rising or falling? Oversold/overbought?
Entry TriggerMACD CrossoverIs there a fresh momentum signal?
Volatility/TimingBollinger BandsIs the stock breaking out of a squeeze?
ConfirmationVolume/OBVIs there conviction behind the move?

A High-Quality Trade Setup looks like this:

  • Price is above the 50 EMA and 200 EMA (trend is up)
  • RSI is between 50–65 (momentum is healthy, not overextended)
  • MACD has just given a bullish crossover (fresh entry signal)
  • Bollinger Bands showed a recent squeeze (volatility was compressed)
  • Today’s breakout candle has 2x average volume (confirmation)

When all five factors align, you have a five-star setup. These don’t come every day, but when they do, they offer exceptional risk-reward ratios.


Risk Management: The Sixth and Most Important “Indicator”

No technical indicator works 100% of the time. The Indian market is influenced by global factors (US Fed policy, crude oil prices, FII flows), domestic macro events (RBI meetings, Budget announcements), and sudden geopolitical developments that no chart can predict.

This is why risk management is non-negotiable:

  • Never risk more than 1–2% of your trading capital on a single trade
  • Always define your stop-loss before entering a trade — based on a logical technical level, not an arbitrary percentage
  • Use a minimum risk-reward ratio of 1:2 — for every ₹1 you risk, target ₹2 in profit
  • Position size according to your stop-loss distance, not emotions

Even the most technically perfect setup fails sometimes. What separates profitable traders from unprofitable ones is not their win rate — it is their discipline in cutting losses small and letting winners run.


Conclusion: Mastering the Language of the Market

The five technical indicators covered in this guide — Moving Averages, RSI, MACD, Bollinger Bands, and Volume — are not magic formulas. They are tools that, when used with discipline, consistency, and sound risk management, significantly improve a trader’s ability to read market conditions and make informed decisions.

The best traders in India’s markets — whether they operate from Nariman Point in Mumbai or trade from home — have one thing in common: they have studied these indicators deeply, backtested them on Indian stocks and indices, and developed their own systematic approach rather than jumping from one “hot strategy” to the next.

Start with one indicator. Master it. Add the next. Build your system methodically. The market rewards those who approach it with patience, knowledge, and discipline.

The charts are speaking. All you need to do is learn to listen.


Disclaimer: This article is for educational purposes only and does not constitute financial advice. Stock market investments are subject to market risks. Please consult a SEBI-registered investment advisor before making any investment decisions.

Top 8 Technical Indicators Every Trader Should Know in Financial & Capital Markets

TECHNICAL INDICATORS

The financial market is a living, breathing entity. Prices surge and collapse, trends emerge and reverse, and fortunes are made or lost in the span of minutes. For centuries, traders have sought ways to decode this chaos — to find order in the noise. Technical analysis is their answer.

Unlike fundamental analysis, which asks what a company is worth, technical analysis asks what the market is doing right now. It does this through technical indicators — mathematical calculations based on historical price, volume, and open interest data — that help traders anticipate future price movements with greater precision.

Whether you’re a seasoned institutional trader on Dalal Street or a retail investor navigating global equities, understanding these indicators is not optional. It’s essential. This article walks you through the most powerful and widely-used technical indicators in capital markets today, explaining what they are, how they work, and — critically — when to use them.


What Are Technical Indicators?

Technical indicators are quantitative tools applied to price charts. They fall into four broad categories:

  • Trend indicators — tell you the direction of the market
  • Momentum indicators — tell you the speed of price movement
  • Volatility indicators — tell you how wildly prices are swinging
  • Volume indicators — tell you the strength behind price moves

Each category answers a different question. Used together, they provide a comprehensive, multi-dimensional picture of market behavior. The goal is never to predict with certainty — markets are inherently probabilistic — but to tilt the odds in your favor.


1. Moving Averages (MA) — The Foundation of Trend Analysis

If technical analysis has a cornerstone, it is the Moving Average. Simple in concept yet powerful in application, a moving average smooths out short-term price fluctuations to reveal the underlying trend direction.

Simple Moving Average (SMA) calculates the arithmetic mean of prices over a defined number of periods. A 50-day SMA, for example, averages the closing prices of the last 50 trading days and plots a single point on the chart. As each new day’s price is added and the oldest drops off, the line “moves.”

Exponential Moving Average (EMA) is a more sophisticated version that assigns greater weight to recent prices, making it more responsive to new information. Traders prefer EMAs in fast-moving markets because they react faster to sudden price changes.

How traders use them: The classic strategy involves two moving averages — a short-term (e.g., 20-day) and a long-term (e.g., 50-day or 200-day). When the short-term MA crosses above the long-term MA, it generates a Golden Cross — a bullish signal. When it crosses below, it forms a Death Cross — a bearish signal.

Moving averages are also used as dynamic support and resistance levels. In a strong uptrend, price tends to bounce off the 50-day or 200-day EMA repeatedly before continuing higher.

Best used for: Identifying trend direction, filtering trade signals, and determining support/resistance zones.


2. Relative Strength Index (RSI) — The Momentum Oscillator

Developed by J. Welles Wilder Jr. in 1978, the Relative Strength Index (RSI) is one of the most universally respected momentum indicators in existence. It measures the speed and magnitude of recent price changes on a scale of 0 to 100.

The formula compares average gains to average losses over a default 14-period lookback window. The result is plotted as a single line that oscillates between 0 and 100.

Key levels:

  • Above 70 → Overbought territory. The asset may be due for a pullback or consolidation.
  • Below 30 → Oversold territory. The asset may be due for a bounce or reversal.
  • 50 line → Acts as the dividing line between bullish (above 50) and bearish (below 50) momentum.

One of the most powerful RSI techniques is divergence. When price makes a new high but RSI fails to confirm it (making a lower high), this bearish divergence warns that the rally is losing steam. Conversely, bullish divergence occurs when price makes lower lows while RSI makes higher lows — a classic reversal signal.

Important nuance: In a strong bull market, RSI can remain in overbought territory for extended periods. Traders who automatically sell when RSI hits 70 in trending markets often exit too early. RSI is most reliable in range-bound or consolidating markets, and should always be confirmed with price action or other indicators.

Best used for: Identifying overbought/oversold conditions, spotting divergences, and gauging momentum strength.


3. Moving Average Convergence Divergence (MACD) — Trend and Momentum in One

The MACD (pronounced “mac-dee”) is arguably the most versatile indicator available to traders. Created by Gerald Appel in the late 1970s, it combines trend-following with momentum analysis, giving traders a two-for-one signal.

The MACD is constructed from three components:

  1. MACD Line = 12-day EMA minus 26-day EMA
  2. Signal Line = 9-day EMA of the MACD Line
  3. Histogram = MACD Line minus Signal Line (displayed as bars above/below a zero line)

How to read it:

  • When the MACD Line crosses above the Signal Line → bullish crossover (buy signal)
  • When the MACD Line crosses below the Signal Line → bearish crossover (sell signal)
  • When the histogram bars grow taller → momentum is increasing
  • When bars shrink → momentum is fading, possibly signaling a reversal

The zero line is also significant. When the MACD Line crosses above zero, it means the short-term average has crossed above the long-term average — a trend confirmation. When it falls below zero, the opposite is true.

Like RSI, MACD divergences are powerful. If price reaches a new high while the MACD histogram makes a lower high, the uptrend may be weakening.

Best used for: Confirming trend direction, identifying entry and exit points, and spotting momentum shifts.


4. Bollinger Bands — Volatility Meets Price Action

Bollinger Bands, developed by John Bollinger in the 1980s, are a volatility-based indicator that places dynamic envelopes around price. They consist of three lines:

  • Middle Band: A 20-day SMA
  • Upper Band: Middle Band + 2 standard deviations
  • Lower Band: Middle Band − 2 standard deviations

The bands expand when volatility increases and contract when volatility decreases — a behavior Bollinger called “the squeeze.” This is their most powerful signal: when bands narrow dramatically, it typically precedes a sharp move in price (though the direction is not always predictable from the squeeze alone).

Key signals:

  • Price touching or breaking the upper band → The market is in an extended rally. In trending markets, this is a continuation signal. In range-bound markets, it may indicate overextension.
  • Price touching or breaking the lower band → The inverse of the above.
  • The W-bottom pattern → Price touches the lower band, bounces, then retests it (making a higher low) while RSI shows bullish divergence — a strong reversal setup.
  • Riding the band → In a strong trend, price can “walk” along the upper or lower band for extended periods.

Best used for: Gauging volatility, identifying breakout potential, and spotting mean-reversion opportunities.


5. Fibonacci Retracement — The Golden Ratio in Markets

Fibonacci retracement levels are based on the famous Fibonacci sequence — a mathematical sequence found throughout nature in which each number is the sum of the two preceding ones. The ratios derived from this sequence (23.6%, 38.2%, 50%, 61.8%, and 78.6%) have an uncanny tendency to act as support and resistance levels in financial markets.

The mechanics are straightforward: you identify a significant swing high and swing low, then draw Fibonacci lines between them. The resulting levels represent potential areas where price might pause, consolidate, or reverse during a retracement.

The 61.8% level — known as the “golden ratio” — is considered the most critical. In strong uptrends, price often retraces to this level before resuming its move higher. A break below it often signals the trend may be reversing.

Traders use Fibonacci levels in two primary ways:

  1. Entry points: Entering a trade at a key Fibonacci level where price is likely to reverse.
  2. Stop loss and target placement: Setting stops just below a Fibonacci support level, and targets at the next Fibonacci resistance level.

Important note: Fibonacci levels are not magic. Their power comes from the fact that so many traders around the world watch the same levels simultaneously, creating self-fulfilling prophecies at those price points.

Best used for: Identifying retracement support/resistance, setting entry points in trending markets, and planning trade management.


6. Volume — The Underrated Indicator

Among all the indicators discussed here, volume is perhaps the most underutilized by retail traders — and the most respected by professionals. Volume represents the total number of shares, contracts, or units traded during a given period. It is the raw measure of market participation and conviction.

The cardinal rule of volume analysis: price moves on high volume are more significant and reliable than price moves on low volume.

Key volume signals:

  • Volume confirming breakout: When a stock breaks above a resistance level on unusually high volume, the breakout is likely genuine. Low-volume breakouts frequently fail.
  • Climactic volume: An enormous spike in volume after a sustained move (up or down) often signals the end of that trend as all buyers/sellers exhaust themselves.
  • Volume divergence: Price rising while volume consistently declines suggests weakening conviction — a warning sign for the trend.

On-Balance Volume (OBV), developed by Joe Granville, refines raw volume into a cumulative line. It adds volume on up days and subtracts it on down days. When OBV diverges from price (rising while price is flat, or falling while price is rising), it can signal that institutional accumulation or distribution is underway before price confirms the move.

Best used for: Confirming breakouts, identifying institutional activity, and detecting trend exhaustion.


7. Stochastic Oscillator — Comparing Price to Its Range

The Stochastic Oscillator, developed by George Lane in the 1950s, measures where the current closing price sits relative to the high-low range over a specified period (typically 14 days). The underlying logic is simple and powerful: in an uptrend, prices tend to close near the high; in a downtrend, they tend to close near the low.

The indicator produces two lines — %K (the fast line) and %D (a 3-period smoothed version of %K) — that oscillate between 0 and 100.

Key signals:

  • Above 80 → Overbought
  • Below 20 → Oversold
  • %K crossing above %D in oversold zone → Bullish crossover (buy signal)
  • %K crossing below %D in overbought zone → Bearish crossover (sell signal)

Like RSI, the stochastic is most effective in range-bound markets. In strong trends, overbought/oversold readings can persist for long periods. Divergences between the stochastic and price action are particularly powerful reversal signals.

Best used for: Short-term trading, identifying potential reversals, and complementing trend indicators.


8. Average Directional Index (ADX) — Measuring Trend Strength

One of the most common mistakes traders make is applying trend-following strategies in sideways, choppy markets — and then wondering why they keep getting stopped out. The Average Directional Index (ADX), developed by Welles Wilder, solves this problem elegantly.

ADX does not tell you which direction the market is trending. It tells you how strongly it is trending — regardless of direction.

ADX ranges from 0 to 100:

  • Below 20 → Weak or no trend (avoid trend-following strategies)
  • 20–25 → Trend beginning to develop
  • 25–50 → Strong, established trend
  • Above 50 → Very strong trend (rare and powerful)

ADX is typically plotted alongside two directional lines: +DI (measuring upward price movement) and −DI (measuring downward price movement). When the +DI crosses above the −DI while ADX is rising above 25, it signals a strengthening uptrend — a powerful buy signal. The reverse is true for downtrends.

Best used for: Filtering trade signals (only take trend-following trades when ADX is above 25), assessing trend strength, and avoiding range-bound chop.


Combining Indicators: The Art of Confluence

No single indicator works perfectly in isolation. The real edge in technical analysis comes from confluence — when multiple independent indicators align and point to the same conclusion simultaneously.

A practical example of a high-probability trade setup:

  1. Trend filter (ADX > 25 and rising) → Confirms a strong trend is in place
  2. Direction (MACD bullish crossover above zero) → Confirms upward momentum
  3. Entry trigger (RSI pulling back to 50 from above, or price at Fibonacci 61.8% support) → Provides an optimal entry point
  4. Volume confirmation (OBV rising) → Confirms institutional participation

When all four align, the probability of success is significantly higher than when only one or two signals agree. This is how professional traders use indicators — not as standalone oracles, but as a multidimensional filter for high-quality setups.


Common Pitfalls to Avoid

Over-reliance on any single indicator: Every indicator lags price to some degree — they are all derived from historical data. No indicator predicts the future; they only improve the probability of your analysis.

Indicator overload: Loading ten indicators on a single chart doesn’t increase accuracy — it creates paralysis and contradictory signals. Most professional traders use three to four complementary indicators at most.

Ignoring price action: Indicators are derived from price. Always remember that pure price action — candlestick patterns, support/resistance levels, and chart patterns — should anchor your analysis. Indicators are tools to confirm, not replace, what you see on the chart.

Ignoring the timeframe: An indicator generating a buy signal on a 5-minute chart may simultaneously be generating a sell signal on a daily chart. Always check multiple timeframes and give priority to the higher timeframe trend.


Conclusion: Mastering the Market’s Language

Technical indicators are not crystal balls. They will not make you rich overnight, and they will sometimes be wrong. But used systematically, with discipline and a clear understanding of what each indicator measures and when it works best, they give traders a decisive edge in navigating the complexity of capital markets.

The journey from understanding individual indicators to combining them into a coherent, battle-tested trading strategy takes time and practice. Start with two or three indicators from different categories — say, the 200-day EMA (trend), RSI (momentum), and volume (participation) — and study how they interact across different market conditions. Paper trade your setups before committing real capital.

The market rewards preparation, patience, and discipline above all else. Technical indicators, wielded with skill, are among the most powerful tools in a trader’s arsenal — not because they predict the future, but because they help you respond to the present with clarity and confidence.


Disclaimer: This article is for educational purposes only and does not constitute financial advice. Always conduct your own research and consider consulting a certified financial advisor before making investment decisions.

HIGH RANKING 10 INVESTMENT STRATEGIES

INVESTMENT STRATEGIES

India’s capital market is one of the fastest-growing in the world. With the Bombay Stock Exchange (BSE) and National Stock Exchange (NSE) serving as the twin pillars of financial activity, India now hosts a market capitalisation of over ₹330 trillion — a figure that has more than doubled in the last five years. For domestic and foreign institutional investors alike, the Indian capital market represents an unmatched combination of growth, liquidity, and diversification.

But raw market growth alone does not translate into returns. The difference between average investors and India’s biggest companies — from Reliance Industries and HDFC Group to Tata SonsBajaj Finance, and global FIIs (Foreign Institutional Investors) — lies in their disciplined adoption of proven investment strategies.

Did You Know? FIIs and DIIs (Domestic Institutional Investors) collectively manage over ₹80 trillion in Indian equities. Their strategic playbooks, while complex, are built on a handful of repeatable frameworks — all of which are accessible to informed retail investors too.

In this article, we break down the top 10 investment strategies that India’s biggest companies and institutional players use to generate consistently high returns in the Indian capital market. Whether you are a retail investor, a portfolio manager, or a corporate treasury officer, these insights will help you build a smarter, more resilient investment approach.

01

Low Risk · Compounding

Systematic Investment Plan (SIP) & Rupee Cost Averaging

The Systematic Investment Plan (SIP) is arguably the most widely practised institutional strategy in India today. While retail investors are familiar with monthly SIPs through mutual funds, large institutional players — including insurance giants like LICSBI Life, and corporate treasuries — use a structured version of this strategy called Rupee Cost Averaging (RCA) across equity portfolios, government securities, and corporate bond markets.

The mechanics are elegant: by investing a fixed corpus at regular intervals regardless of market conditions, companies accumulate more units when prices are low and fewer when prices are high. Over a full market cycle (typically 7–10 years), this strategy consistently outperforms lump-sum investments made at market peaks. India’s mutual fund industry crossed ₹53 trillion in AUM in 2024, with SIP inflows alone contributing over ₹19,000 crore every month — a testament to the strategy’s dominance.

Large conglomerates also extend this philosophy to treasury management: allocating surplus cash into liquid and debt mutual funds through systematic programmes rather than parking funds in low-yield savings accounts.

Key Takeaways

  • Reduces the impact of short-term market volatility on overall portfolio cost
  • Harnesses the power of compounding across equity and debt markets
  • Reduces emotional decision-making — a discipline critical for large fund managers
  • Best suited for long-term goals of 5 years and beyond

02

Fundamental · Long-Term

Value Investing — The Buffett Blueprint, Indian Edition

Value investing is the cornerstone strategy of some of India’s most celebrated investors and institutional funds. Inspired by Warren Buffett and Benjamin Graham’s principles, Indian players like Radhakishan Damani (founder of DMart), Rakesh Jhunjhunwala, and fund houses such as DSP Mutual Fund and Parag Parikh Financial Advisory Services (PPFAS) have built immense wealth by identifying fundamentally strong businesses trading below their intrinsic value.

The Indian capital market offers fertile ground for value investors. Due to the market’s occasional bouts of irrationality — driven by global FII outflows, geopolitical shocks, or domestic macroeconomic data — blue-chip and mid-cap companies often trade at significant discounts to their true worth. Skilled value investors use DCF (Discounted Cash Flow) analysisPrice-to-Book (P/B) ratios, and Price-to-Earnings (P/E) comparisons against historical averages and sectoral benchmarks to identify these opportunities.

“In the Indian context, value investing requires patience measured in years, not quarters. The biggest mistake is selling a great business too early.” — A leading Indian fund manager

Key Metrics Used

  • P/E Ratio below industry average or historical mean
  • Return on Equity (ROE) consistently above 15%
  • Low Debt-to-Equity ratio (preferably below 0.5)
  • Consistent free cash flow generation over 5+ years
  • Promoter holding above 50% — a signal of conviction

03

Technical · Trend-Based

Momentum Investing & Trend-Following Strategy

Momentum investing operates on a simple but powerful premise: stocks that have performed well in the recent past tend to continue performing well in the near future. This strategy is extensively used by algorithmic trading desks of large brokerage firms, FIIs, and hedge funds operating in Indian markets through registered FPI (Foreign Portfolio Investor) routes.

In India, momentum is particularly strong in the mid-cap and small-cap segments of BSE and NSE. Studies of NSE data spanning two decades consistently show that a momentum portfolio — rebalanced quarterly by selecting the top 20% of stocks by 12-month returns — outperforms the Nifty 50 by 4–6% on an annualised basis. Institutional players using this strategy deploy sophisticated quantitative screens combined with moving average crossoversRelative Strength Index (RSI) signals, and 52-week high breakouts to time their entries.

Companies like Kotak Mahindra AMCNippon India Mutual Fund, and major SEBI-registered Portfolio Management Services (PMS) firms run dedicated momentum-based funds that have delivered Nifty-beating returns over 3–5 year periods.

Tools & Indicators Used

  • 12-month price momentum with 1-month reversal filter
  • 200-day EMA (Exponential Moving Average) as trend filter
  • RSI above 60 for entry confirmation
  • High FII accumulation signals on NSE F&O data

04

Hybrid · Quality Growth

Growth at a Reasonable Price (GARP)

GARP — Growth at a Reasonable Price — is the hybrid strategy that bridges the gap between pure value investing and aggressive growth investing. Pioneered globally by Peter Lynch and widely adopted by India’s top institutional investors, GARP identifies companies with above-average earnings growth potential that are still available at valuations below their growth-adjusted fair value.

In practical terms, GARP investors in India look for companies where the PEG (Price/Earnings to Growth) ratio is below 1.5 — meaning the stock’s P/E multiple is comfortably supported by its earnings growth rate. Indian sectors like banking and financial servicespharmaceuticalsconsumer discretionary, and information technology regularly produce GARP opportunities, especially during broader market corrections.

Large AMCs such as HDFC Mutual Fund and Axis Mutual Fund have historically run successful GARP-oriented large-cap schemes that have outperformed benchmarks over 10-year periods. For corporate treasuries managing long-term equity portfolios, GARP provides the discipline needed to avoid overpaying for growth while not missing genuinely transformative businesses.

GARP Screening Criteria

  • EPS growth rate of 15–25% over 3 years
  • PEG ratio below 1.5
  • Sustainable competitive moat (brand, technology, regulation)
  • Revenue growth aligned with earnings growth (no margin-compression growth)

05

Macro · Theme-Driven

Sectoral & Thematic Investing

Sectoral and thematic investing involves concentrating capital in specific sectors or macro themes expected to grow significantly over a 3–10 year horizon. This is one of the most actively used strategies by large Indian corporates, family offices, and domestic institutional investors (DIIs) who have the resources to conduct deep sectoral research.

India’s development journey has created several powerful multi-decade themes. The government’s PLI (Production Linked Incentive) schemes have triggered massive capital allocation into sectors like semiconductors, solar energy, defence manufacturing, and specialty chemicals. Big companies like Reliance Industries identified the telecom and digital infrastructure theme early, while the Tata Group made bold bets on electric vehicles and renewable energy well before they became consensus trades.

Current high-conviction thematic areas include digital infrastructure and data centresgreen energy transitiondefence indigenisation under Make in Indiahealthcare and diagnostics, and rural consumption growth. SEBI-approved thematic mutual fund schemes have proliferated, with AMCs launching dedicated Infrastructure, PSU, and Manufacturing funds that have posted exceptional 3-year returns.

High-Conviction Themes (2025)

  • Green Energy: Solar, Wind, and Green Hydrogen
  • Defence & Aerospace Manufacturing
  • Digital Infrastructure: Data Centres, Cloud, AI
  • Specialty Chemicals & Pharma APIs
  • Rural Consumption & FMCG

06

Income · Steady Returns

Dividend Growth & Income Investing

Dividend growth investing focuses on companies that not only pay dividends but have a consistent track record of increasing their dividends year after year. This strategy is particularly favoured by insurance companiespension funds, and large corporate treasuries that require predictable, recurring income streams alongside capital appreciation.

India’s PSU (Public Sector Undertaking) stocks — including ONGC, Coal India, Power Grid Corporation, and REC Limited — have historically been strong dividend payers, often yielding 4–8% annually in addition to potential capital gains. Private sector dividend champions include InfosysTCSITC, and HCL Technologies. Large institutional holders of these stocks effectively earn a compounding income stream that, when reinvested, dramatically boosts long-term total returns.

Post the 2020 change in dividend taxation — where dividends are now taxed in the hands of investors at their applicable slab rate — corporates have become more strategic, prioritising companies with consistent buyback programmes alongside dividends to optimise post-tax returns.

Dividend Investing Criteria

  • Dividend yield above 3% with a 5-year growth track record
  • Payout ratio below 60% (ensures sustainability)
  • Strong free cash flow coverage of dividends (1.5x or above)
  • Low or zero debt on balance sheet

07

Data-Driven · Algo

Quantitative & Factor-Based Investing

Quantitative investing uses mathematical models, statistical analysis, and increasingly artificial intelligence to identify investment opportunities and manage risk. In India, this approach has gained enormous traction over the past decade, driven by the rise of algorithmic trading on NSE’s co-location servers and the proliferation of SEBI-registered quant PMS and AIF (Alternative Investment Fund) vehicles.

Factor-based investing — a systematic subset of quant investing — exploits specific risk-return drivers called “factors”. In the Indian context, the five most empirically validated factors are: Value (cheap stocks relative to fundamentals), Momentum (recent price strength), Quality (high ROE, low debt), Low Volatility (stable stocks), and Size (small and mid-caps). Combining multiple factors — often called a multi-factor strategy — has historically delivered significant alpha over the Nifty 500 in Indian backtests.

Institutional players such as DSP Quant FundNippon India Quant Fund, and proprietary desks of leading brokerages run fully automated strategies that process thousands of data points — from earnings revision signals and options market data to satellite imagery of retail footfall — to generate investment signals at scale.

Key Factors Used in Indian Markets

  • Quality Factor: ROE, ROCE, earnings stability
  • Momentum Factor: 12-1 month price momentum
  • Value Factor: EV/EBITDA, P/B relative to sector
  • Low Volatility: Beta-adjusted portfolio construction
  • Growth Factor: EPS revision momentum

08

High Risk · High Reward

Private Equity & Pre-IPO Investment Strategy

Private equity (PE) and pre-IPO investing represent the high-octane, high-conviction end of the investment spectrum. While restricted to sophisticated investors and institutions due to regulatory requirements under SEBI’s AIF framework, this strategy has generated some of the most spectacular returns in the Indian capital market over the past decade.

Indian conglomerates and family offices — including those managed by the Premji family (Wipro/Azim Premji Invest)Zerodha’s Nikhil Kamath, and major PE firms like ChrysCapitalSequoia India (Peak XV Partners), and General Atlantic — have profited enormously by identifying India’s unicorn startups early. Companies like Zomato, Paytm, Nykaa, Delhivery, and Jio Financial Services created massive wealth for early institutional investors who entered at pre-IPO valuations.

The strategy involves identifying companies with strong unit economicslarge addressable marketsscalable technology moats, and capable founders — then holding through the IPO window and beyond. With India’s IPO market consistently ranking among the world’s most active, this strategy continues to attract significant institutional capital.

Pre-IPO Investment Checklist

  • TAM (Total Addressable Market) of ₹50,000 crore or above
  • Path to profitability within 18–24 months of investment
  • Strong founder pedigree and institutional co-investors
  • Regulatory clearances and scalable unit economics

09

Future-Proof · Responsible

ESG (Environmental, Social & Governance) Investing

ESG investing has transitioned from a niche ethical preference to a mainstream institutional imperative in India. SEBI’s introduction of the Business Responsibility and Sustainability Report (BRSR) mandate for the top 1,000 listed companies, along with the global alignment of Indian capital markets with international ESG standards, has made ESG analysis a non-negotiable component of institutional due diligence.

Major global FIIs — including BlackRock, Vanguard, and Norges Bank Investment Management (Norway’s sovereign wealth fund) — have adopted strict ESG filters for their Indian equity allocations. Domestically, SBI Mutual FundICICI Prudential AMC, and Quantum Mutual Fund have launched dedicated ESG funds that screen out companies with poor environmental records, weak governance structures, or unsustainable labour practices.

Beyond ethical considerations, the financial case for ESG investing in India is compelling. Studies show that BSE-listed companies with high ESG scores exhibit lower stock price volatility, better credit ratings, lower cost of capital, and superior long-term returns compared to ESG-laggards. As India accelerates its Net Zero 2070 commitment, ESG-aligned companies in renewables, sustainable manufacturing, and responsible finance are positioned for structural outperformance.

ESG Factors Evaluated

  • E: Carbon footprint, water usage, waste management, renewable energy adoption
  • S: Employee welfare, supply chain ethics, community impact, diversity
  • G: Board independence, audit quality, promoter transparency, related-party transactions
  • BRSR score and third-party ESG rating (MSCI, Sustainalytics)

10

Risk Management · Advanced

Derivatives & Hedging Strategy for Portfolio Protection

Derivatives-based hedging is the sophisticated risk management strategy used by virtually every large institutional investor in India to protect equity portfolios against market downturns while maintaining upside participation. India’s NSE F&O (Futures and Options) market is one of the largest in the world by contract volume — a reflection of the enormous institutional appetite for risk management tools.

Large companies and fund houses use several hedging techniques. Index put options on Nifty 50 and Bank Nifty act as insurance against broad market selloffs. Covered call writing on large-cap holdings generates additional income during sideways or mildly bullish markets. Futures-based delta hedging is used by portfolio managers to neutralise market-directional risk while retaining stock-specific alpha. Corporate treasuries also use currency futures and forwards on NSE/BSE to hedge foreign exchange exposure on import payables and export receivables.

The strategic use of derivatives is not speculation — it is insurance. Companies like Tata Consultancy ServicesInfosys, and Wipro actively hedge their multi-billion dollar USD revenue exposure through structured forex derivatives programmes, directly protecting earnings and shareholder value from currency volatility.

Common Hedging Instruments in India

  • Nifty Put Options — broad market downside protection
  • Index Futures — short-term portfolio beta management
  • Covered Call Writing — income generation on long equity holdings
  • USD/INR Currency Futures — forex exposure hedging
  • Interest Rate Swaps — corporate debt cost management

Conclusion: Building a Winning Investment Framework

The Indian capital market in 2025 is no longer a playing field only for specialists. With deepening market infrastructure, robust regulatory oversight by SEBI, and unprecedented access to financial data and analytical tools, the strategies used by India’s biggest companies are increasingly within reach of informed individual investors too.

The key insight from studying institutional behaviour is that no single strategy dominates in all market conditions. The most successful investors — whether they manage ₹500 crore or ₹5 lakh crore — combine multiple frameworks: value investing for the core portfolio, momentum for tactical allocations, ESG for risk filtration, and derivatives for downside protection.

What separates consistently successful investors is not superior intelligence — it is disciplined process, long-term conviction, and the ability to remain rational when markets are emotional. Study these strategies, adapt them to your risk profile and investment horizon, and approach the Indian capital market with the patience and rigour of a long-term institutional investor.

India’s greatest wealth-creation engine is its capital market. The question is not whether to participate — but how strategically you choose to do so.

Disclaimer: This article is published for educational and informational purposes only. It does not constitute financial advice or a recommendation to buy or sell any securities. Investing in capital markets involves risk, including the possible loss of principal. Please consult a SEBI-registered investment advisor before making any investment decisions. Past performance is not indicative of future results.

MUTUAL FUNDS DETAILED ANALYSIS ON EXPENSES

MUTUAL FUNDS

Mutual Funds Explained: Expense Ratio, Sharpe Ratio & Key Metrics Every Investor Must Know (2026 Guide)

Meta Description: Learn everything about mutual funds — expense ratio, Sharpe ratio, alpha, beta, standard deviation, NAV, and more. A complete beginner-to-advanced guide to investing smarter in 2025.

Target Keywords: mutual funds, expense ratio, Sharpe ratio, mutual fund metrics, how to invest in mutual funds, mutual fund performance indicators, alpha beta mutual funds, NAV mutual fund, mutual fund returns


What Are Mutual Funds?

A mutual fund is a professionally managed investment vehicle that pools money from multiple investors to purchase a diversified portfolio of stocks, bonds, or other securities. Each investor owns “units” or “shares” of the fund, and the fund’s performance is distributed proportionally.

In India alone, the mutual fund industry managed over ₹65 lakh crore in Assets Under Management (AUM) as of 2025, reflecting the explosive growth in retail participation. In the US, the industry manages over $25 trillion in assets.

Whether you are a first-time investor or a seasoned market participant, understanding the key metrics and ratios of mutual funds is not optional — it is essential for making informed financial decisions.


How Mutual Funds Work

When you invest in a mutual fund:

  1. Your money is pooled with thousands of other investors.
  2. A fund manager (or a team) actively or passively manages the portfolio.
  3. The fund invests in securities aligned with its stated objective (e.g., large-cap equities, government bonds, gold).
  4. Your returns are a reflection of the underlying portfolio’s performance, minus costs.

The beauty of mutual funds lies in diversification — even a small investment of ₹500 or $50 via a SIP (Systematic Investment Plan) gives you exposure to dozens or hundreds of securities.


Types of Mutual Funds

Before diving into metrics, here is a quick overview of the main categories:

  • Equity Mutual Funds — Invest primarily in stocks; higher risk, higher potential returns.
  • Debt Mutual Funds — Invest in fixed-income instruments like bonds; relatively lower risk.
  • Hybrid Mutual Funds — A mix of equity and debt to balance risk and return.
  • Index Funds — Passively track a market index such as Nifty 50 or S&P 500.
  • ELSS (Equity Linked Savings Scheme) — Tax-saving funds under Section 80C in India with a 3-year lock-in.
  • Liquid Funds — Invest in very short-term instruments; ideal for parking emergency funds.
  • International Funds — Invest in foreign markets for global diversification.
  • Sectoral/Thematic Funds — Concentrated exposure to specific industries like technology, pharma, or banking.

Each type comes with its own risk profile and ideal investor profile.


Expense Ratio: The Silent Return Killer

What Is the Expense Ratio?

The expense ratio is the annual fee that a mutual fund charges its investors to cover operating costs, including fund management fees, administrative expenses, marketing costs, and regulatory fees. It is expressed as a percentage of the fund’s total assets.

Formula:

Expense Ratio = (Total Annual Fund Expenses ÷ Average AUM) × 100


Why Does the Expense Ratio Matter?

The expense ratio is deducted from the fund’s NAV on a daily basis — meaning you never see it as a direct charge, but it silently erodes your returns over time.

Example: Suppose two funds both generate a gross return of 12% per year.

  • Fund A has an expense ratio of 0.10% (index fund)
  • Fund B has an expense ratio of 1.50% (actively managed fund)

Over 20 years on a ₹1 lakh investment:

  • Fund A grows to approximately ₹8.62 lakh
  • Fund B grows to approximately ₹7.14 lakh

The difference? Over ₹1.48 lakh — lost entirely to fees!


What Is a Good Expense Ratio?

Fund TypeLow (Good)AverageHigh (Expensive)
Index/ETF0.05% – 0.20%0.20% – 0.50%Above 0.50%
Active Equity0.50% – 1.00%1.00% – 1.50%Above 2.00%
Debt Funds0.20% – 0.50%0.50% – 1.00%Above 1.50%

Pro Tip: SEBI in India has imposed TER (Total Expense Ratio) limits based on AUM slabs. Always opt for Direct Plans over Regular Plans — they have a 0.5%–1.5% lower expense ratio since there is no distributor commission.


Sharpe Ratio: Measuring Risk-Adjusted Returns

What Is the Sharpe Ratio?

Developed by Nobel laureate William F. Sharpe, the Sharpe ratio measures the return earned per unit of total risk taken. It helps investors understand whether a fund’s returns are the result of smart investing decisions or excessive risk-taking.

Formula:

Sharpe Ratio = (Fund Return − Risk-Free Rate) ÷ Standard Deviation of Fund Returns

  • Fund Return: The annualised return of the mutual fund.
  • Risk-Free Rate: Typically the return on a government bond or a fixed deposit (e.g., 6.5% in India).
  • Standard Deviation: The volatility of the fund’s returns.

How to Interpret the Sharpe Ratio

Sharpe RatioInterpretation
Below 1.0Poor — risk not adequately compensated
1.0 – 1.99Good — decent risk-adjusted performance
2.0 – 2.99Very Good — strong performance
3.0 and aboveExcellent — outstanding risk-adjusted returns

Example:

  • Fund X returns 14%, risk-free rate is 6.5%, standard deviation is 15%
  • Sharpe Ratio = (14 − 6.5) ÷ 15 = 0.50 (Not great)
  • Fund Y returns 14%, risk-free rate is 6.5%, standard deviation is 9%
  • Sharpe Ratio = (14 − 6.5) ÷ 9 = 0.83 (Better!)

Both funds delivered the same return — but Fund Y did so with significantly less volatility, making it the superior choice from a risk-adjusted perspective.


Alpha: Are Fund Managers Adding Value?

What Is Alpha?

Alpha represents the excess return of a mutual fund compared to its benchmark index after adjusting for risk. A positive alpha means the fund manager has generated returns above what the market would have delivered. A negative alpha means underperformance.

Formula:

Alpha = Fund Return − [Risk-Free Rate + Beta × (Benchmark Return − Risk-Free Rate)]

Interpreting Alpha

  • Positive Alpha (+2): The fund outperformed its benchmark by 2% on a risk-adjusted basis — excellent.
  • Zero Alpha: The fund matched its benchmark — similar to owning an index fund.
  • Negative Alpha (−1.5): The fund underperformed the benchmark by 1.5% — the manager destroyed value.

For actively managed funds, consistent positive alpha over 3–5 years is the primary justification for paying a higher expense ratio. If a fund consistently shows negative or near-zero alpha, switching to a low-cost index fund makes far more economic sense.


Beta: Understanding Market Sensitivity

What Is Beta?

Beta measures a mutual fund’s sensitivity to movements in its benchmark index. It indicates how much the fund’s value is likely to change when the market moves by a certain percentage.

Beta ValueMeaning
Beta = 1.0Fund moves in line with the market
Beta > 1.0Fund is more volatile than the market (aggressive)
Beta < 1.0Fund is less volatile than the market (defensive)
Beta < 0Fund moves inversely to the market (rare)

Example: A fund with a beta of 1.3 means that if the Nifty 50 rises by 10%, the fund is expected to rise by 13%. Conversely, if the index falls by 10%, the fund may fall by 13%.

Who Should Care About Beta?

  • Conservative investors and retirees should prefer low-beta funds.
  • Aggressive growth investors may prefer high-beta funds during bull markets.
  • Beta is especially useful when combined with the Treynor Ratio (explained later).

Standard Deviation: Gauging Volatility

What Is Standard Deviation in Mutual Funds?

Standard deviation measures the degree to which a fund’s returns deviate from its average (mean) return over a specific period. It is the most widely used measure of total risk in a portfolio.

A higher standard deviation means the fund’s returns are more unpredictable — swinging wildly from highs to lows. A lower standard deviation indicates steadier, more consistent returns.

Example:

  • Fund A: Average annual return of 12% with a standard deviation of 5% → returns typically range from 7% to 17%
  • Fund B: Average annual return of 12% with a standard deviation of 20% → returns typically range from −8% to 32%

Both funds have the same average return, but Fund A offers far more predictable outcomes for conservative investors.


Sortino Ratio: A Smarter Risk Metric

The Sortino Ratio is a refinement of the Sharpe Ratio. The key difference? While the Sharpe Ratio penalises both upside and downside volatility, the Sortino Ratio only penalises downside volatility — which is the risk most investors actually care about.

Formula:

Sortino Ratio = (Fund Return − Risk-Free Rate) ÷ Downside Deviation

A higher Sortino Ratio indicates better risk-adjusted performance, specifically relative to harmful downside risk. For equity funds that experience large temporary drawdowns, the Sortino Ratio is often a more meaningful metric than the Sharpe Ratio.


What Is NAV?

NAV (Net Asset Value) is the per-unit price of a mutual fund. It is calculated at the end of every trading day.

Formula:

NAV = (Total Assets − Total Liabilities) ÷ Total Units Outstanding

Common NAV Misconception

Many investors mistakenly believe that a fund with a lower NAV (say ₹10) is “cheaper” and thus a better buy than a fund with a higher NAV (say ₹500). This is completely incorrect.

NAV by itself tells you nothing about value. A fund with NAV of ₹500 may have been growing steadily for 15 years and represent excellent value, while a new fund at ₹10 NAV may never recover from poor performance. What matters is the growth trajectory and underlying portfolio quality, not the absolute NAV figure.


Portfolio Turnover Ratio

What Is Portfolio Turnover?

The portfolio turnover ratio measures how frequently a fund buys and sells its holdings within a year. It is expressed as a percentage.

  • High Turnover (above 100%): The fund manager frequently trades, incurring higher transaction costs and tax implications — which can reduce net returns.
  • Low Turnover (below 30%): A buy-and-hold approach that reduces costs and is tax-efficient.

Index funds typically have turnover ratios of less than 10%, while some active funds churn their portfolios at 150–200% annually. High turnover without corresponding outperformance is a red flag.


AUM (Assets Under Management)

AUM refers to the total market value of all investments managed by a mutual fund at a given point in time.

Why AUM Matters

  • Very small AUM (below ₹100 crore) can indicate a fund struggling to attract investors — which may affect liquidity.
  • Very large AUM in small-cap or mid-cap funds can be a problem — it becomes harder to take meaningful positions in smaller companies without moving the market.
  • For liquid and debt funds, larger AUM usually signals stability and better deal-making ability.

A fund’s AUM should always be evaluated in the context of its category, not in isolation.


Treynor Ratio

The Treynor Ratio (also called the reward-to-volatility ratio) is similar to the Sharpe Ratio but uses beta (systematic/market risk) instead of standard deviation (total risk) in the denominator.

Formula:

Treynor Ratio = (Fund Return − Risk-Free Rate) ÷ Beta

The Treynor Ratio is best used when comparing diversified funds that are part of a larger portfolio — since unsystematic (company-specific) risk has already been diversified away. A higher Treynor Ratio is better.


How to Compare Mutual Funds Using These Metrics

When evaluating and shortlisting mutual funds, follow this structured framework:

Step 1 — Define Your Goal Are you investing for wealth creation, regular income, tax saving, or capital preservation? This determines the right fund category.

Step 2 — Check Rolling Returns (3-Year, 5-Year, 10-Year) Don’t rely on point-to-point returns. Rolling returns show consistency across multiple market cycles.

Step 3 — Evaluate the Expense Ratio Always prefer the Direct Plan. Compare expense ratios within the same category. For passive funds, the expense ratio should be near 0.10%–0.20%.

Step 4 — Analyse the Sharpe Ratio Among similar funds with similar returns, pick the one with a higher Sharpe Ratio — it took less risk to deliver those returns.

Step 5 — Check Alpha Over Multiple Periods A fund with consistent positive alpha over 5+ years justifies active management costs.

Step 6 — Review Beta Based on Your Risk Appetite Aggressive investors can tolerate high-beta funds; conservative investors should look for beta below 0.8.

Step 7 — Assess Standard Deviation Especially important for goal-based investing. A fund with very high standard deviation is unsuitable for goals within 3 years.

Step 8 — Verify AUM and Fund House Track Record Check the fund house’s overall credibility, fund manager tenure, and whether AUM is appropriate for the fund’s strategy.


Common Mistakes Investors Make

1. Chasing Past Returns A fund that returned 45% last year is not guaranteed to repeat that performance. Evaluate consistency, not peak performance.

2. Ignoring the Expense Ratio Even a 0.5% difference in expense ratio can cost lakhs over a 20-year investment horizon.

3. Confusing Low NAV with Cheap Valuation NAV is just a price per unit, not a quality indicator.

4. Over-Diversification Holding 15–20 different mutual funds does not necessarily reduce risk — many funds in the same category hold overlapping stocks. Aim for 4–6 well-diversified funds.

5. Stopping SIPs During Market Crashes Market downturns are when SIPs work best — you accumulate more units at lower prices, averaging down your cost.

6. Ignoring Tax Implications Equity funds held under 1 year attract 20% Short-Term Capital Gains (STCG). Held over 1 year, gains above ₹1.25 lakh are taxed at 12.5% LTCG (post Budget 2024 rules in India).


FAQs About Mutual Fund Metrics

Q1. What is a good Sharpe Ratio for a mutual fund? Generally, a Sharpe Ratio above 1.0 is considered good. Above 2.0 is excellent. However, always compare Sharpe Ratios within the same fund category, not across different asset classes.

Q2. Is a higher expense ratio justified for actively managed funds? Only if the fund consistently delivers alpha above the additional cost. If a fund has a 1.5% expense ratio but only generates 0.5% alpha, the net benefit is negative.

Q3. Should I prefer low-beta or high-beta funds? It depends on your investment horizon and risk tolerance. For a 10+ year horizon, high-beta equity funds have historically rewarded patient investors well. For shorter horizons or if you are risk-averse, low-beta funds are more appropriate.

Q4. Does a fund’s NAV matter when choosing a mutual fund? No. NAV only tells you the current price per unit. What matters for comparison purposes is the fund’s returns, risk ratios, and portfolio quality — not its absolute NAV value.

Q5. What is the ideal expense ratio for an index fund? For index funds and ETFs, an expense ratio of 0.05% to 0.20% is considered very good. Anything above 0.50% for an index fund should prompt you to look for better alternatives.


Final Thoughts: Invest Smarter, Not Harder

Mutual funds are one of the most accessible, diversified, and professionally managed investment tools available to retail investors today. But simply putting money into a “top-rated” fund without understanding the underlying metrics is like buying a car based solely on its paint colour.

The metrics covered in this guide — expense ratio, Sharpe ratio, alpha, beta, standard deviation, Sortino ratio, NAV, portfolio turnover, AUM, and Treynor ratio — collectively paint a comprehensive picture of a fund’s cost, performance, and risk profile.

Here’s a quick recap of what to look for:

MetricWhat You Want
Expense RatioLower is better
Sharpe RatioHigher is better (above 1 is good)
AlphaPositive, consistent alpha
BetaMatches your risk appetite
Standard DeviationLower for conservative goals
Sortino RatioHigher is better
Portfolio TurnoverLower is generally better
AUMAppropriate for fund’s strategy
Treynor RatioHigher is better for diversified funds

Before making any investment, always read the Scheme Information Document (SID) and the Key Information Memorandum (KIM). Consider consulting a SEBI-registered financial advisor for personalised guidance.

Remember: The best mutual fund is not the one with the highest past return — it is the one best aligned with your financial goals, risk tolerance, investment horizon, and cost sensitivity.


Disclaimer: This article is for informational and educational purposes only. It does not constitute financial or investment advice. Please consult a qualified financial advisor before making investment decisions.


What is SIP(systematic investment plan) and How does it works?

what is SIP

The Magic of Consistency: Mastering the Art of the Systematic Investment Plan (SIP)

In the world of finance, there is a recurring myth that you need a massive windfall—a “mountain of gold”—to start building serious wealth. We often picture the stock market as a playground exclusively for the elite, filled with complex tickers and high-stakes gambles.

But what if the most powerful tool for wealth creation wasn’t a secret tip or a lucky break, but a simple, disciplined habit? Enter the Systematic Investment Plan (SIP). It is the financial equivalent of a marathon; it’s not about how fast you run the first mile, but the fact that you keep moving, step by step, until you reach the finish line.

What Exactly is an SIP?

At its core, a Systematic Investment Plan (SIP) is a method of investing a fixed sum of money into a mutual fund at regular intervals—usually monthly, quarterly, or even weekly. Instead of trying to “time the market” by waiting for prices to drop, you invest consistently regardless of market conditions.

Think of it like a subscription service for your future self. Just as you pay for Netflix or Spotify every month, an SIP automates your savings, moving money from your bank account into a chosen investment portfolio.

The Core Philosophy

The SIP philosophy is built on three pillars:

  1. Discipline: It forces you to save before you spend.
  2. Averaging: It turns market volatility into an advantage.
  3. Compounding: It harnesses the “eighth wonder of the world” by staying invested for the long haul.

How Does an SIP Actually Work?

To understand how an SIP functions, we need to look at the mechanics of Net Asset Value (NAV) and Rupee Cost Averaging.

1. The Allocation of Units

When you invest in a mutual fund, you are buying “units.” The price of one unit is called the NAV.

  • If the market is up, the NAV is high, and your fixed investment buys fewer units.
  • If the market is down, the NAV is low, and your fixed investment buys more units.

2. Rupee Cost Averaging

This is the “secret sauce” of SIPs. Because you are buying more units when prices are low and fewer when prices are high, your average cost per unit over time tends to be lower than the average market price. You essentially stop worrying about whether the market is at a “peak” or a “trough” because the system self-corrects.

3. The Power of Compounding

Compounding happens when the returns on your investment start earning their own returns. In an SIP, the longer you stay invested, the more dramatic the growth becomes.

The mathematical formula for the future value of an SIP is:

$$FV = P \times \frac{(1 + r)^n – 1}{r} \times (1 + r)$$

Where:

  • $FV$ = Future Value
  • $P$ = Monthly investment amount
  • $r$ = Monthly rate of interest (Annual rate / 12)
  • $n$ = Number of installments (Months)

Even a small monthly contribution can balloon into a significant corpus over 15 to 20 years because of this exponential growth curve.

Why Choose SIP over Lumpsum?

While a lumpsum investment (investing a large amount all at once) can be profitable if timed perfectly, it carries significant emotional and financial risk. Here is how they compare:

FeatureSIPLumpsum
Market TimingNot required; eliminates guesswork.Crucial; buying at a peak can hurt returns.
AffordabilityStart small (often as low as $500).Requires a large initial capital.
Risk ProfileMitigates volatility through averaging.Higher risk of immediate capital loss.
PsychologyPromotes disciplined, stress-free saving.Can lead to “investor’s remorse” during dips.

The Step-by-Step Guide to Starting Your SIP

Starting an SIP is simpler than it has ever been. With modern fintech apps and digital banking, you can set one up in under ten minutes.

Step 1: Define Your Financial Goals

Are you saving for a down payment on a house? Your child’s education? Or a comfortable retirement? Assigning a goal to your SIP helps you stay motivated when the market gets bumpy.

Step 2: Choose the Right Fund Type

Not all SIPs are created equal. You must match the fund to your risk appetite:

  • Equity Funds: High risk, high reward. Best for long-term goals (7+ years).
  • Debt Funds: Lower risk, steady returns. Good for short-to-medium-term goals.
  • Hybrid Funds: A mix of both, providing a balanced approach.

Step 3: Determine the Amount and Frequency

Be realistic. It is better to start a small SIP that you can maintain for ten years than a large one that you have to cancel after six months because of a cash crunch.

Step 4: Automate the Process

Set up an “Auto-debit” or “Bank Mandate.” By automating the transfer, you remove the “choice” of whether to invest or spend, ensuring your financial goals stay on track.

Common Myths vs. Reality

Despite their popularity, several misconceptions surround SIPs. Let’s clear the air:

Myth: SIPs are only for small investors.

Reality: While SIPs are accessible for small investors, many high-net-worth individuals use them to manage liquidity and reduce the risk of entering a volatile market with millions at once.

Myth: You cannot stop an SIP once started.

Reality: SIPs offer incredible flexibility. You can pause, stop, or increase (Top-up) your investment at any time without heavy penalties.

Myth: SIPs guarantee positive returns.

Reality: SIPs are a method of investing, not a guarantee. They are subject to market risks. However, historically, the probability of negative returns decreases significantly as the investment duration increases beyond 5–7 years.

Strategies for Success: “The Pro Moves”

If you want to take your SIP journey from “good” to “extraordinary,” consider these advanced strategies:

1. The Step-Up SIP

Increase your SIP amount annually in line with your salary hikes. Even a 10% annual increase in your SIP contribution can nearly double your final corpus over long periods.

2. Don’t Fear the Dip

When the market crashes, the natural instinct is to panic and stop the SIP. This is a mistake. A market dip is when your SIP works hardest, buying more units at “sale” prices. Continuing your SIP during a bear market is the single most effective way to build wealth.

3. Review, Don’t React

Check your portfolio once or twice a year to ensure the fund is performing well compared to its benchmark. Do not check it daily; the “noise” of daily market fluctuations will only lead to emotional decision-making.

The Psychological Edge: Peace of Mind

Beyond the numbers, the greatest benefit of an SIP is psychological freedom.

We live in an era of information overload. Every day, news headlines scream about inflation, geopolitical tensions, or interest rate hikes. Trying to navigate these as an individual investor is exhausting. An SIP acts as a shield. It allows you to ignore the noise, knowing that your wealth is growing quietly in the background while you focus on your career, your family, and your life.

Conclusion: The Best Time to Start was Yesterday

In finance, there is a famous saying: “The best time to plant a tree was 20 years ago. The second best time is now.”

The math of an SIP is undeniable—time is a much more powerful factor than the amount invested. By starting today, even with a modest sum, you are giving your money the time it needs to grow, compound, and eventually provide you with the financial freedom you deserve.

The journey to financial independence doesn’t require a miracle. It just requires a system. Start your SIP today, stay the course, and let time do the heavy lifting.


Disclaimer

The information provided in this article is for educational and informational purposes only and does not constitute financial, investment, or professional advice. Investing in Mutual Funds through a Systematic Investment Plan (SIP) involves market risks, including the possible loss of principal. Past performance is not a reliable indicator of future results. Before making any investment decisions, it is recommended that you:

  • Conduct your own research or consult with a certified financial advisor.
  • Assess your risk appetite and financial goals thoroughly.
  • Read all scheme-related documents carefully to understand the specific risks associated with any fund.

The author and publisher are not responsible for any financial losses or decisions made based on the content of this article.

Trent company Trent Limited Q4 FY26 Results: Revenue Surges 20%

Trent

Trent Limited Q4 FY26 Results: Revenue Surges 20% to Rupees 4,937 Crore as Zudio Nears 1,000 Stores — A Complete Analysis

Trent Limited reports strong Q4 FY26 results with revenue rising 20% YoY to Rupees 4,937 crore. Zudio adds 109 stores in Q4. Full analysis of Trent’s FY26 performance, store expansion, stock movement, and outlook.


Trent Signals a Decisive Comeback

In a financial landscape that has been testing the resilience of India’s retail sector, Trent Limited — the retail arm of the iconic Tata Group — has delivered a statement of intent. On April 6, 2026, the company released its provisional business update for the fourth quarter (Q4) and full fiscal year ending March 31, 2026, and the numbers tell a story of accelerating momentum, disciplined execution, and a retail strategy that is clearly resonating with Indian consumers.

The headline figure: standalone revenue from operations rose 20% year-on-year in Q4 FY26, the fastest growth rate the company recorded in any quarter during the fiscal year. This is not merely a statistical uptick. It represents a genuine re-acceleration after a brief period of relatively slower growth in Q2 and Q3 FY26, when Trent posted what analysts had flagged as the weakest quarterly growth in four years. The recovery, swift and decisive, has sent a clear message to the markets — and the stock responded accordingly.

For investors, analysts, retail watchers, and consumers alike, Trent’s Q4 FY26 results offer a detailed window into one of India’s most dynamic retail stories: the rise of Zudio, the steady evolution of Westside, the bold push into smaller Indian cities, and now, the first steps onto international soil.


Q4 FY26 Revenue: The Numbers That Moved the Market

Trent Limited reported standalone revenue from operations (excluding GST) of Rupees 4,937 crore for Q4 FY26, up from Rupees 4,106 crore in the same quarter of the previous year. This translates to a year-on-year growth of 20%, making it the strongest quarterly performance of FY26.

To put this in perspective, Rupees 4,937 crore is approximately 532.80 million US dollars at current exchange rates — a figure that underscores the scale at which Trent is now operating within India’s competitive retail ecosystem.

What makes this number even more significant is where the growth is coming from. Revenue from the sale of merchandise — the pure core of Trent’s retail business, excluding other operating income — grew at an even faster clip of 21% year-on-year during Q4. This indicates that the growth is not being inflated by non-recurring income streams or accounting adjustments. It is real, consumer-driven, on-the-ground demand, and it is showing up in the cash registers of Trent’s stores across India.

The company has noted that these figures remain subject to statutory audit. Final audited results, including detailed profitability metrics such as net profit, EBITDA, and margin data, are expected to be declared in mid-April 2026. However, given the strength of the top-line, market participants have already begun revising their expectations upward.


FY26: A Rupees 19,701 Crore Business

Zooming out from the quarter to the full fiscal year, Trent’s FY26 performance paints an equally compelling picture. The company posted full-year standalone revenue of Rupees 19,701 crore, up 18% from Rupees 16,668 crore in FY25. On a merchandise-sales basis, the full-year growth rate stands at 19% — robust, consistent, and well ahead of most peers in the listed Indian retail space.

To appreciate the scale of this achievement, consider that Trent crossed the Rupees 19,000 crore revenue milestone for the first time in its history during FY26. This is a company that has more than doubled its revenue in a span of just three years, a growth trajectory that very few businesses — retail or otherwise — can claim in the Indian market.

The consistency between quarterly and annual growth metrics is also noteworthy. Many companies post a strong final quarter to shore up annual numbers, while their intra-year performance tells a different story. In Trent’s case, the 19% full-year merchandise growth aligns closely with the 21% Q4 figure, suggesting that the demand environment has been broadly stable — and that the Q4 acceleration represents a genuine improvement rather than a base-effect anomaly.


The Zudio Effect: India’s Most Aggressive Retail Expansion Story

If there is one factor that defines Trent’s growth story in FY26, it is Zudio. The value-fashion brand, which targets young, fashion-conscious, price-sensitive Indian consumers, has rapidly transformed from a domestic fast-fashion concept into a national — and now international — retail phenomenon.

As of March 31, 2026, Zudio operated 963 stores, of which six are located in the UAE, marking the brand’s first significant international foray. During Q4 FY26 alone, Trent added 109 net Zudio stores — a number that works out to roughly one new store every single day of the quarter. Over the full year, Zudio recorded net additions of 198 stores, its largest annual expansion on record.

The numbers are extraordinary when placed in the context of India’s retail history. Very few retail brands in any category — apparel, electronics, food — have scaled to nearly 1,000 locations in such a compressed timeframe. Zudio is on the verge of becoming a four-digit store network, a milestone that would place it in the company of India’s most ubiquitous retail brands.

What is Zudio’s secret formula? The brand sits in the sweet spot of the Indian market: it is affordable without appearing cheap, trendy without being exclusive, and accessible without sacrificing quality. Its core customer is the young, aspirational Indian consumer — someone who follows fashion trends, has limited disposable income, and expects value for money. This demographic is enormous, and it is growing. India’s young population, combined with rising incomes, urbanisation, and increased fashion awareness, is creating a runway for Zudio that is difficult to overstate.

The six UAE stores add another layer to the story. Zudio’s international debut suggests that Trent’s management sees real demand among the Indian diaspora and, potentially, price-sensitive fashion consumers in global markets. If the UAE pilot succeeds, it could pave the way for Zudio’s broader international expansion, creating an entirely new growth vector for the company.


Westside: The Reliable Anchor of Trent’s Portfolio

While Zudio grabs most of the headlines, Westside — Trent’s flagship premium lifestyle brand — continues to play a vital supporting role in the company’s overall portfolio.

During Q4 FY26, Trent added 22 net Westside stores, bringing the full-year total additions to 52 stores. As of March 31, 2026, Westside operates a network of 300 stores across India — a milestone in itself for a brand that positions itself at the premium-to-mid end of the Indian apparel market.

Westside’s store expansion may appear more measured compared to Zudio’s aggressive rollout, but this is by design. Westside targets metro cities and larger tier-1 and tier-2 towns where consumers have higher disposable incomes and a preference for curated fashion experiences. The brand’s in-house design philosophy, which ensures a significant portion of its merchandise is exclusive to Westside, creates a differentiated proposition that justifies its premium positioning.

The growth of Westside to 300 stores is significant for another reason: it provides a stable, higher-margin revenue base that complements the high-volume, lower-margin Zudio business. Together, these two brands create a portfolio that can capture value across India’s income pyramid — from the aspirational shopper in a tier-3 city buying from Zudio to the discerning professional in Mumbai shopping at Westside.


Market Reaction: Stock Surges Nearly 6% in a Falling Market

The market’s reaction to Trent’s Q4 FY26 business update was swift and decisive. On April 6, 2026, shares of Trent Limited surged 5.93% to Rupees 3,761.20 on the NSE, compared to the previous close of Rupees 3,550.60. At the session’s intraday peak, the stock touched Rupees 3,791.90, briefly approaching the Rupees 3,800 level.

This rally was particularly notable because it came against a backdrop of broader market weakness — the Nifty 50 fell 0.61% on the same day. Trent’s stock was effectively swimming against the tide, driven purely by the strength of its fundamental results.

The stock has had a challenging year overall. As of early April, shares are down roughly 16% from the start of 2026, and the 52-week range extends from a low of Rupees 3,275.50 to a high of Rupees 6,261. The results-driven rally has, at least temporarily, reawakened investor interest in the stock and sparked fresh debate about whether the worst is behind Trent from a valuation perspective.

Analysts covering the stock had been cautious in recent quarters, pointing to a deceleration in same-store sales growth and rising operating costs from aggressive store additions. The Q4 results, however, show that the revenue growth engine remains firmly intact, and market participants appear to be reassessing their earlier pessimism.


Macro Tailwinds: How India’s Economy Is Supporting Trent’s Growth

No analysis of Trent’s Q4 results would be complete without acknowledging the broader macro environment that has supported consumer spending in India.

India’s government introduced tax cuts in late September 2025 that effectively put more disposable income in the hands of millions of consumers across income brackets. This fiscal stimulus, combined with strong employment trends, wage growth in the organised sector, and rising digital payments penetration, has created a supportive environment for discretionary spending — precisely the kind of spending that benefits a lifestyle retail company like Trent.

The effect has been visible in retail data across the sector. Consumer spending on apparel and lifestyle products has held up strongly despite global headwinds, including currency volatility and supply chain pressures. Trent, with its diversified brand portfolio and aggressive store expansion, has been positioned well to capture this spending wave.

Additionally, India’s rapid urbanisation continues to create new consumer markets. Cities that did not appear on a retailer’s expansion map five years ago are today viable locations for fashion retail. Zudio’s strategy of penetrating smaller towns — tier-2 and tier-3 cities — is a direct play on this urbanisation trend, and the results suggest it is working.


Strategic Priorities: Smaller Cities, Deeper Penetration, and Debt Capital

Trent’s management has signalled clearly that the pace of expansion will not slow down anytime soon. The company’s strategic priorities for the near term include three key pillars:

1. Deeper penetration into smaller Indian cities. Trent has explicitly stated its intention to expand store presence in cities and towns beyond the major metro markets. This is where India’s next wave of fashion consumers is emerging, and Zudio — with its affordable price points and wide product range — is ideally suited to capture this opportunity.

2. Continued aggressive store rollouts. The pace of net store additions in FY26 — 198 Zudio and 52 Westside — is expected to be sustained or exceeded in FY27. Management has made clear that scale is a strategic priority, and the company is willing to invest heavily in building out its footprint.

3. Capital raising for the next growth phase. In a significant move that has been read as a bullish signal by market observers, Trent recently received approval to raise Rupees 500 crore through non-convertible debentures (NCDs). This debt capital is expected to fund the company’s ongoing expansion programme, providing the financial firepower to sustain its store-opening spree without putting undue pressure on its equity base.


The Road Ahead: What to Watch in Q4 Detailed Results and FY27

The business update released on April 6 is a provisional top-line disclosure, not a full set of audited financial results. The detailed quarterly results — covering net profit, EBITDA, gross margins, store-level economics, and management commentary — are expected in the coming weeks.

Several key metrics will be closely watched by analysts and investors:

Profitability: With the rapid expansion of the Zudio network, the critical question is whether revenue growth is translating into profit growth. New stores typically take time to reach maturity and profitability. If Trent can demonstrate expanding margins alongside top-line growth, it would significantly strengthen the investment case.

Same-Store Sales Growth (SSSG): Raw revenue growth driven by new store additions is encouraging, but same-store sales growth — which measures revenue performance from stores that have been operational for at least 12 months — is the true test of demand vitality. Investors will watch this number closely.

Zudio’s UAE performance: The six international stores are a small portion of the overall network, but their performance will be scrutinised as a proxy for Zudio’s potential beyond India.

Balance sheet health: With Rupees 500 crore in NCDs in the pipeline and ongoing capital expenditure for store fit-outs, investors will want to ensure that Trent’s balance sheet remains healthy and its debt levels manageable.


Conclusion: Trent’s Growth Story Remains One of India’s Most Compelling

Trent Limited’s Q4 FY26 business update is more than just a set of impressive quarterly numbers. It is a validation of a long-term retail strategy built on two simple but powerful ideas: give Indian consumers fashion they can afford, and be present wherever they are.

The 20% quarterly revenue growth, a full-year revenue base of Rupees 19,701 crore, a store network of 1,286 outlets, and Zudio’s unprecedented expansion to nearly 1,000 stores — including its first international footprint in the UAE — all paint the picture of a company that is executing well and thinking strategically about the future.

Challenges remain. Profitability must keep pace with expansion. Same-store growth must hold up. The balance sheet must be managed carefully as the company borrows to fuel growth. And the competition in India’s fashion retail space — from both domestic players and international fast-fashion giants — is intensifying.

But on the basis of what Trent has delivered in FY26, there is every reason to believe that the company is on the right side of India’s most powerful consumer trend: the rise of a young, aspirational, fashion-aware middle class that demands quality, affordability, and accessibility all at once.

The Tata Group’s retail arm is no longer a mid-sized apparel company. It is fast becoming one of India’s defining retail institutions — and its Q4 FY26 results are a powerful reminder of just how far and how fast it has come.


Disclaimer: This article is for informational purposes only and does not constitute financial or investment advice. All figures mentioned are provisional and subject to statutory audit. Investors are advised to conduct independent research and consult a qualified financial advisor before making investment decisions.


HDFC Bank Crisis 2026: Why the Chairman Resigned and 3 Top Executives Were Fired

hdfc bank

HDFC Bank Governance Crisis 2026: AT1 Bond Scandal, Executive Terminations, and the Chairman’s Exit

The Indian banking sector was sent into a tailspin in March 2026 as HDFC Bank, the country’s largest private-sector lender, faced a dual-pronged crisis of leadership and ethics. Within a single week, the bank witnessed the abrupt resignation of its Part-time Chairman, the termination of three top-tier executives, and a staggering ₹1.34 lakh crore ($16 billion) erosion in market capitalization.

At the heart of this turmoil is a brewing scandal involving the alleged mis-selling of Additional Tier-1 (AT1) bonds to High-Net-Worth Individuals (HNIs) and Non-Resident Indians (NRIs). This article explores the intricate details of the AT1 controversy, the high-profile exits, and what this means for the future of India’s most valuable bank.


1. The AT1 Bond Controversy: Mis-selling and Global Fallout

The crisis traces its roots to the bank’s international operations in Dubai (DIFC) and Bahrain. Internal investigations revealed a systemic failure in the sale of complex financial instruments—specifically Credit Suisse AT1 bonds.

What are AT1 Bonds?

Additional Tier-1 (AT1) bonds are perpetual debt instruments used by banks to maintain regulatory capital. While they offer higher yields (often 10% to 13%), they carry a “loss-absorbency” clause. If the issuing bank faces a financial collapse, these bonds can be written down to zero before equity is touched.

The Nature of the Allegations

The controversy erupted when NRI clients alleged that HDFC Bank employees misrepresented these high-risk bonds:

  • Safety Misrepresentation: Bonds were allegedly pitched as “safe, fixed-maturity products,” comparable to traditional FCNR (Foreign Currency Non-Resident) deposits.
  • Aggressive Fund Diversion: Clients were reportedly persuaded to move secure deposits from India to overseas accounts in Bahrain to fund these bond purchases.
  • Lack of Disclosure: Critical risks—such as the fact that the bonds had no maturity date and could be wiped out—were allegedly omitted during the sales pitch.
  • The 2023 Trigger: When Credit Suisse collapsed in 2023, its AT1 bonds worth $17 billion were written down to zero. NRI investors who purchased these through HDFC Bank lost their entire principal.

2. Termination of Top Executives: A “Clean-up” Operation

On March 20-21, 2026, HDFC Bank took the unprecedented step of terminating three of its most senior leaders. This move followed a year-long internal probe and mounting pressure from the Dubai Financial Services Authority (DFSA).

Who was Removed?

The bank’s “accountability sweep” targeted the very top of its international and branch banking hierarchy:

ExecutiveRoleSignificance of Removal
Sampath KumarGroup Head, Branch BankingOverseer of the entire branch network; his exit signals a major governance lapse.
Harsh GuptaExecutive Vice PresidentHead of Middle East, Africa, and NRI Onshore Business; the direct leader of the affected branches.
Payal MandhyanSenior Vice PresidentHeld accountable for oversight lapses in client onboarding and sales practices.

The bank stated that these terminations were “remedial actions” taken to address gaps in client onboarding and maintain internal compliance standards.


3. The Resignation of Atanu Chakraborty: An Ethical Stand?

While the AT1 bond probe was concluding, the bank suffered a second blow. On March 18, 2026, Part-time Chairman Atanu Chakraborty resigned with immediate effect.

His resignation letter contained a “poison pill” for the bank’s reputation:

“Certain happenings and practices within the bank, that I have observed over the last two years, are not in congruence with my personal values and ethics.”

Market Reaction and Governance Concerns

The phrasing of the letter—specifically the mention of “values and ethics”—triggered panic.

  • Stock Crash: HDFC Bank shares plummeted nearly 9% in a single day, hitting a 52-week low.
  • Valuation Wipeout: The bank’s market cap fell below 2020 pandemic levels, trading at a price-to-book (P/B) ratio of ~2.2x.
  • Board Response: To stabilize the ship, the Reserve Bank of India (RBI) approved Keki Mistry (former HDFC Ltd CEO) as the interim chairman for three months.

5. Regulatory Scrutiny: RBI and DFSA Actions

The fallout has not been limited to internal firings.

  • DFSA Restraint: The Dubai regulator has reportedly restricted HDFC Bank’s DIFC branch from onboarding new clients.
  • RBI Monitoring: While the RBI stated there are “no material concerns on record” regarding the bank’s overall financials, it has indicated it will continue to engage closely with the board.
  • Investor Lawsuits: Affected NRI clients are reportedly exploring legal options to recover the $100–$120 million lost in the AT1 bond write-down.

A table comparing the safety of traditional deposits versus the risk of AT1 bonds is a “value magnet” for readers.

Comparison: FCNR Deposits vs. AT1 Bonds

FeatureFCNR (Fixed Deposit)AT1 Bonds (Additional Tier-1)
Risk LevelLow (Bank-backed)Very High (Equity-like risk)
MaturityFixed (1–5 years)Perpetual (No fixed maturity)
Principal SafetyGuaranteed at maturityCan be written to ZERO
ReturnsFixed InterestHigher Coupon (10–13%)
LiquidityEasy premature withdrawalHard to sell during crises

Conclusion: A Turning Point for HDFC Bank?

The events of March 2026 mark the most significant leadership crisis since the HDFC-HDFC Bank merger. While the bank remains financially robust and well-capitalized, the “ethics storm” has bruised its image as the gold standard of Indian banking.

For investors, the key will be the findings of the external law firms and whether the bank can successfully pivot its culture from “aggressive sales” to “client suitability.”

HDFC Bank and TCS Lead Sensex Freefall to 52-Week Lows

hdfc bank and tcs

HDFC Bank and TCS Lead Sensex Freefall to 52-Week Lows

The Indian equity market witnessed one of its most turbulent sessions in recent history on Thursday, March 19, 2026. In a dramatic “risk-off” move, the BSE Sensex plummeted by nearly 2,500 points, closing at 74,207, while the Nifty 50 crashed over 770 points to settle at the psychological support level of 23,000.

The carnage was not merely a number on a screen; it represented a staggering erosion of over ₹11.5 lakh crore in investor wealth in a single day. Most notably, the “Big Boys” of the index—HDFC Bank and Tata Consultancy Services (TCS)—were among five prominent Sensex constituents that hit their 52-week lows, marking a significant sentiment shift for India’s most trusted blue-chip stocks.

The “Low” List: Five Stocks in the Eye of the Storm

While the entire market ended in the red, these five Sensex heavyweights reached their lowest price points in the last year, with some correcting as much as 16% in just 30 days.

Stock Name52-Week Low (Mar 19)Approx. 1-Month DeclineKey Triggers
Bajaj Finserv₹1,704.55~16%FII selling, hawkish Fed stance
Kotak Mahindra Bank₹363.10~14%Sectoral weakness, margin pressure
HDFC Bank₹772.00~13%Chairman resignation, FII outflows
TCS₹2,350.10~13%Global tech spend caution, AI concerns
ITC₹297.10~10%Profit booking, broader market drag

1. HDFC Bank: A Leadership Vacuum and Institutional Exit

HDFC Bank, the bellwether of the Indian banking sector, has faced a grueling month. The stock hit a fresh 52-week low of ₹772 today. The primary catalyst for the immediate 5% intraday drop was the sudden resignation of its part-time Chairman, Atanu Chakraborty, who cited “ethical concerns” in a regulatory filing.

For an institution built on the pillars of governance and stability, such a departure is a major red flag for Foreign Institutional Investors (FIIs). Combined with the heaviest fortnightly selling by FIIs in 17 years, HDFC Bank’s price action reflects a deep “trust deficit” that technical analysts believe may take months to mend.

2. TCS: The IT Titan Hits a Global Speed Bump

Despite announcing a significant strategic partnership with Amadeus to build next-gen airline solutions, TCS shares fell 3.2% to a 52-week low of ₹2,350.10.

The irony of the situation was not lost on the market: a global deal was announced, yet the stock tanked. This highlights the current “cautious and selective” mood. Investors are no longer rewarding “potential” deals; they are demanding visibility on immediate revenue. With the US Federal Reserve signalling “higher for longer” interest rates and a hawkish outlook on inflation, the discretionary tech spend by US enterprises is expected to remain tight, directly squeezing the margins of Indian IT majors.


The Macro Forces: Why the Market is Bleeding

To understand why these giants are falling, we must look at the “Perfect Storm” of global and domestic factors currently hitting Dalal Street.

The Crude Oil Shock

Brent crude prices have surged past $110 per barrel, touching $118 in some sessions. For an oil-importing giant like India, this is the ultimate “inflation tax.” High oil prices lead to:

  • Wider Current Account Deficit (CAD): Weakening the Rupee.
  • Rising Input Costs: Slashing corporate profit margins across sectors like Auto, Paints, and Aviation.

The Federal Reserve’s “Hawkish” Shadow

On March 18, the US Federal Reserve kept interest rates unchanged but increased its inflation outlook. This dashed hopes of early rate cuts, leading to a spike in US bond yields. When US yields rise, FIIs typically pull money out of emerging markets like India to seek “risk-free” returns in the US, leading to the massive sell-offs we are seeing in HDFC and TCS.

The Rupee at Record Lows

The Indian Rupee hit a historic low of ₹92.89 against the US Dollar today. While a weak rupee usually benefits IT exporters, the sheer scale of FII outflows (nearly $8 billion in recent weeks) has created a liquidity crunch that has overshadowed any currency-related gains for the IT sector.


Expert Insights: Distribution or Structural Breakdown?

The sharp correction has left retail investors wondering if this is a “buying opportunity” or a “falling knife.”

Ruchit Jain, Head of Equity Technical Research at Motilal Oswal Financial Services, notes:

“The index heavyweights have witnessed a sharp sell-off due to persistent FII selling. Until external data—geopolitical news, FII flows, and Crude prices—change direction, these stocks are likely to continue underperforming.”

On the other hand, Anshul Jain of Lakshmishree Research suggests that this phase reflects a “sentiment reset” rather than a structural collapse. He points out that historically, drawdowns of 15–25% in frontline large-caps like TCS and HDFC Bank often offer favorable entry zones for long-term “buy-and-hold” investors.


What Should Investors Do Next?

Navigating a market crash requires a balance of caution and conviction. Here is a professional roadmap for the current scenario:

  1. Avoid Catching the “Falling Knife”: Technical indicators like the RSI (Relative Strength Index) for many of these stocks are near 28 (oversold), but in a panic market, “oversold” can stay “oversold” for a long time. Wait for a base formation before entering.
  2. Monitor the “Psychological Floors”: For the Nifty 50, the 22,850–23,000 zone is critical. A decisive close below 23,000 could open the doors for a further slide toward 22,500.
  3. Focus on Cash-Rich Companies: In high-interest-rate environments, companies with low debt and high cash reserves (like many in the IT and FMCG sectors) are better positioned to survive the volatility.
  4. Watch the Geopolitical Pulse: The intensifying tensions in West Asia are the primary driver of oil volatility. Any signs of de-escalation could lead to a sharp “short-covering” rally.

Conclusion

The sight of TCS and HDFC Bank at 52-week lows is a stark reminder that even the most robust portfolios are not immune to global macro shifts. While the “blood on the streets” is painful for existing holders, it serves as a reality check on valuations that had perhaps become too stretched in early 2026.

For the disciplined investor, the key is not to panic but to watch for the stabilization of the Rupee and the cooling of oil prices as the first signals of a market bottom.

REC Limited Dividend 2026: Record Date, Yield, and ₹3.20 Payout Details

REC Limited headquarters showing ₹3.20 dividend announcement

REC Ltd Announces ₹3.20 Dividend for March 2026: Key Dates, Yield, and Performance Analysis

REC Limited, the Maharatna Power Finance PSU, has officially declared its fourth interim dividend for the financial year 2025-26. This announcement comes as a significant update for income-focused investors, reinforcing REC’s reputation as one of the most consistent dividend-paying stocks in the Indian market.

Below is a comprehensive breakdown of the dividend details, record dates, and an analysis of the stock’s current yield.


REC Dividend 2026: The Core Details

The Board of Directors of REC Limited, in their meeting held on March 16, 2026, approved a fourth interim dividend of ₹3.20 per equity share. This dividend represents 32% of the face value of ₹10 per share.

Key MetricDetails
Dividend Amount₹3.20 per share
Dividend Type4th Interim Dividend (FY 2025-26)
Face Value₹10.00
Record DateMarch 20, 2026
Ex-Dividend DateMarch 20, 2026
Payment DateOn or before April 14, 2026

Note for Investors: To be eligible for this payout, you must hold the shares in your Demat account before the market closes on the day prior to the Ex-dividend date.

2. Yield Analysis: Why REC Stands Out

At a current market price of approximately ₹332, the forward dividend yield remains one of the most attractive in the Nifty Midcap index.

  • Trailing 12-Month (TTM) Dividend: ~₹18.40 – ₹20.00 per share.
  • Current Dividend Yield: ~5.5% to 6.0%.
  • Payout Sustainability: REC maintains a payout ratio of roughly 25-30% of its net profits. Unlike many private firms that reinvest all capital, REC’s status as a PSU requires it to share a healthy portion of earnings with the government (the majority shareholder) and retail investors.

Investor Insight: While the stock price has seen a correction from its 52-week high of ₹444, the dividend yield has conversely increased. For value investors, this “price-yield inverse” often presents a buying opportunity, effectively getting more “income per rupee” invested.

3. Q3 FY26 Financial Snapshot: Stability Amid Volatility

Dividends are only as good as the profits that fund them. REC’s Q3 FY26 results (ended Dec 31, 2025) showcase a fortress-like balance sheet:

  • Net Profit: Stood at ₹4,043.08 crore, remaining steady year-on-year.
  • Asset Quality (The Star Performer): REC has undergone a massive cleanup of its books.
    • Gross NPA: Improved sharply to 0.88% (down from nearly 2% a year ago).
    • Net NPA: At an incredible 0.20%.
  • Provisioning Coverage Ratio (PCR): 76.96%, ensuring the company is well-protected against any potential loan defaults.
  • Capital Adequacy (CRAR): A robust 24.26%, far above the regulatory requirements.

This level of financial health is why 11 out of 14 market analysts currently maintain a “Strong Buy” rating on the stock, with target prices reaching as high as ₹458.

4. Strategic Evolution: Restructuring and “Viksit Bharat”

The biggest news surrounding REC in early 2026 isn’t just the dividend—it’s the Government’s Restructuring Plan. Announced in the Budget 2026-27, the government plans to restructure REC and its parent, PFC (Power Finance Corporation).

What this means for you:

  1. No Merger (For Now): The government has clarified that a full merger is unlikely due to RBI exposure limits. Instead, the focus is on operational synergy.
  2. Energy Transition focus: REC is shifting from purely “rural electrification” to “Green Financing.” It is now the primary lender for Green Hydrogen, EV infrastructure, and Battery Storage projects.
  3. Loan Book Growth: REC aims for a ₹10 lakh crore loan book by 2030. This suggests a CAGR of over 13% for the next four years, providing the growth “fuel” for future dividends.

5. Comparison: REC vs. PFC vs. IRFC

In the battle of the “Finance PSUs,” where does REC sit?

FeatureREC LtdPFCIRFC
Dividend Yield~5.8%~3.9%~2.2%
P/E Ratio~5.1~8.1~18.1
Asset QualityExcellent (Net NPA 0.20%)GoodSuperior (Zero NPA)
FocusPower/RenewablesPower/InfraRailways

Verdict: While IRFC is “safer” due to its zero-NPA model, REC offers a significantly higher dividend yield and lower valuation (P/E), making it the preferred choice for aggressive income seekers.

6. Potential Risks to Monitor

No investment is without risk. For REC, keep an eye on:

  • Interest Rate Fluctuations: As a lender, REC’s margins (NIMs) are sensitive to RBI rate changes.
  • Sector Concentration: Heavy exposure to the power sector means any policy shift in State Discoms can impact loan recoveries.
  • Market Sentiment: As a mid-cap PSU, it can be more volatile than large-cap stocks during global market sell-offs.

Final Takeaway

The ₹3.20 dividend is a testament to REC’s consistent cash-generating machine. With a record date of March 20, 2026, investors have a narrow window to position themselves for this payout. Combined with a clean balance sheet and a clear role in India’s “Viksit Bharat” 2030 vision, REC remains a cornerstone for any diversified Indian portfolio.

Reliance to invest in first new US oil refinery in 50 years, says Trump; calls $300 billion Texas project ‘historic deal’

Reliance

Trump Hails ‘Historic’ $300 Billion Texas Oil Refinery Deal with Reliance Industries: A New Era of Global Energy Dominance

In a move that has sent shockwaves through the global energy markets, U.S. President Donald Trump has announced a “historic $300 billion deal” to construct the first major new oil refinery in the United States in over 50 years. At the heart of this massive infrastructure project is an unprecedented partnership with India’s largest private-sector conglomerate, Reliance Industries (RIL), led by billionaire Mukesh Ambani.

The project, spearheaded by America First Refining (AFR), is set to be located at the Port of Brownsville, Texas. Trump characterized the development as a “massive win for American workers” and a cornerstone of his “America First” energy agenda, aimed at securing total energy independence amid escalating global geopolitical tensions.

Key Insights: Why This Deal Matters

  • End of a 50-Year Drought: This is the first “grassroots” refinery (built from the ground up) in the U.S. since 1977.
  • Massive Scale: The $300 billion figure represents the estimated total economic value of the 20-year offtake and production agreement.
  • Strategic Reliance Partnership: Reliance Industries is providing a “nine-figure investment” and has signed a binding 20-year agreement to purchase and distribute the refinery’s products.
  • Shale-Optimized Technology: Unlike older U.S. refineries designed for heavy foreign crude, this facility will process 100% American light shale oil.
  • Geopolitical Timing: The announcement comes as the Strait of Hormuz faces disruptions and oil prices hover near $100–$120 per barrel due to the conflict in West Asia.

The $300 Billion Vision: Breaking Down the Numbers

While the construction cost of a modern refinery typically ranges between $6 billion and $10 billion, the $300 billion valuation cited by President Trump encompasses the long-term trade impact and production value.

According to filings from America First Refining, the deal involves:

  1. Processing Power: The refinery will process roughly 1.2 billion barrels of U.S. light shale oil over two decades.
  2. Product Value: It is expected to produce 50 billion gallons of refined products (gasoline, diesel, and jet fuel) worth an estimated $175 billion.
  3. Trade Balance: The project is projected to improve the U.S. trade imbalance by $300 billion by reducing the need for imported refined products and boosting global exports.

“This is what American Energy Dominance looks like. We are streamlining permits and lowering taxes to bring billions of dollars back to our nation,” Trump stated via Truth Social.

Reliance Industries: The Global Powerhouse in Texas

The involvement of Reliance Industries is a masterstroke of global diplomacy and corporate strategy. Reliance already operates the world’s largest single-location refining complex in Jamnagar, India. By investing in the Brownsville project, Mukesh Ambani is effectively exported Reliance’s world-class refining expertise to American soil.

For Reliance, this move provides a critical hedge. As India faces its own energy challenges due to the Iran-Israel conflict, securing a 20-year supply chain of refined products from the U.S. ensures long-term stability for its global trading desk.

Why Brownsville, Texas?

The Port of Brownsville is strategically located near the Permian Basin, the most productive oil field in the U.S. By refining shale oil at the source, the new facility eliminates the “mismatch” currently plaguing the Gulf Coast—where 50-year-old refineries are often unable to efficiently process the light, sweet crude produced by the American shale revolution.

Economic Impact: Jobs and Energy Security

The Texas refinery is expected to be “the cleanest refinery in the world,” utilizing next-generation carbon-capture and hydrogen-ready technologies. Beyond environmental benchmarks, the economic ripples will be felt immediately:

  • Job Creation: Thousands of high-paying construction and engineering jobs are expected during the groundbreaking, scheduled for Q2 2026.
  • National Security: By processing domestic shale into fuel, the U.S. becomes less vulnerable to “actuarial warfare”—where maritime chokepoints like the Strait of Hormuz can be closed by rising insurance costs or military conflict.
  • Consumer Relief: Though the refinery will take years to become fully operational, the announcement serves as a signal to markets that long-term supply is being addressed, potentially stabilizing volatile gas prices.

Technical Innovation: “The Cleanest Refinery in the World”

While critics often argue that new oil infrastructure is a step backward for the environment, America First Refining has countered this by positioning the Brownsville plant as a Green-Refining Hybrid.

Key technical features include:

  • Hydrogen Integration: The facility will use green hydrogen for the desulfurization process, significantly reducing its carbon footprint.
  • Zero-Liquid Discharge: Advanced water recycling systems will ensure that no industrial wastewater is released into the local ecosystem—a critical promise for the delicate coastal environment of South Texas.
  • Modular Design: Unlike the sprawling, inefficient plants of the 1970s, this refinery uses a modular architecture that allows for rapid construction and future upgrades for biofuels or synthetic fuels.

The “Trump-Ambani” Synergy: A Match Made in Energy Heaven

The partnership between Donald Trump and Mukesh Ambani represents a fusion of “America First” nationalism and “Global India” ambition. Ambani’s Reliance Industries is not just a passive investor; they are the operators of the future.

Reliance’s Jamnagar complex is a marvel of engineering that operates at over 100% capacity and can process almost any type of crude. By bringing this operational excellence to Texas, Reliance is helping the U.S. overcome its “infrastructure amnesia”—the loss of technical know-how that occurs when an industry goes 50 years without building a new flagship facility.

Market Reaction: Why RIL Stock Dipped Despite the News

Interestingly, while the news is “historic,” Reliance Industries (RIL) shares saw a slight 0.5% dip on the NSE following the initial 2% rally. Financial analysts suggest this is a “wait-and-see” reaction from institutional investors.

  • Capital Expenditure Concerns: A project of this magnitude requires significant upfront cash. Investors are looking for clarity on the debt-to-equity ratio Reliance will use for its “nine-figure” investment.
  • Timeline Risks: Building a refinery takes years. While the Q2 2026 groundbreaking is ambitious, regulatory hurdles and construction delays are common in large-scale energy projects.
  • Long-Term Offtake: The 20-year binding agreement is a double-edged sword. It guarantees revenue, but it also locks Reliance into a specific pricing structure in a world where the energy transition is accelerating.

Regional Impact: South Texas as the New “Silicon Valley of Energy”

The Port of Brownsville and the surrounding Rio Grande Valley have long been overlooked in the Texas energy boom. This deal changes that overnight.

  • Thousands of Jobs: The project is expected to create 10,000+ construction jobs and 1,500 permanent high-skilled roles.
  • Economic Opportunity Zone: Being located in a designated Opportunity Zone, the project provides massive tax incentives for the developers while bringing infrastructure like new roads, power grids, and housing to the local community.
  • Education and Training: Local universities and trade schools in South Texas are already preparing to launch specialized “Refinery Tech” programs to feed the workforce pipeline.

Final Verdict: A $300 Billion Gamble on the Future of Oil

As we move deeper into 2026, the Reliance-Texas deal stands as a bold bet that oil will remain the bedrock of global power for decades to come. By combining American resources with Indian refining expertise and Trump’s deregulatory “America First” policies, this project aims to rewrite the rules of the energy market.

It is a deal of superlatives: the first in 50 years, the biggest in history, and potentially the most consequential for the 21st-century global economy.